
Table of Contents
Jump to a section
We currently run Plausible for visitor analytics on awsfundamentals.com. It's a great piece of software and it just works, but we wanted more control over the data: our own retention, our own schema, and no third-party script sitting between us and the numbers.
So we built our own dashboard, with two different ingest pipelines fed by our CloudFront real-time logs instead: pageviews, unique visitors, top pages.
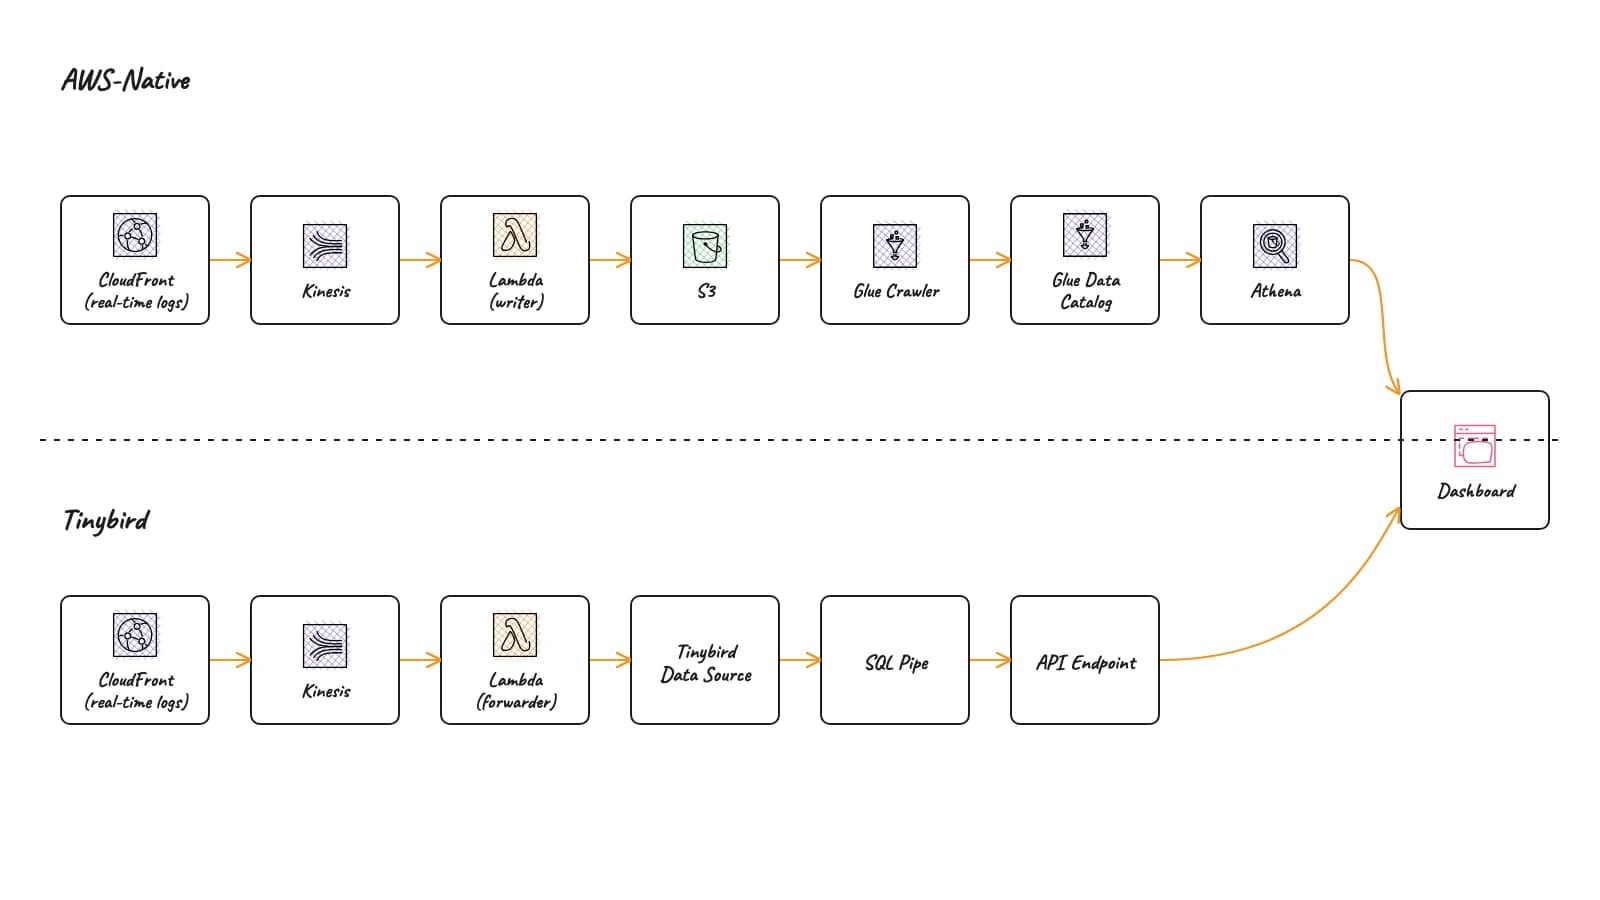
Once the AWS-native way: CloudFront real-time logs into Kinesis, a Lambda writer, S3, a Glue crawler, and Athena for querying. Once on Tinybird: the same Kinesis stream, a Lambda forwarder, a Tinybird Data Source, a SQL Pipe, and a generated API endpoint.
Neither pipeline puts a script in the visitor's browser: the browser talks to CloudFront as before, and our own Lambda does the forwarding. That's the part that matters for the "no third-party script" motivation above.
Both pipelines read the same CloudFront logs and feed the same UI, side by side. That's what makes the comparison below fair: same input data and output dashboard, but two different backend pipelines.
Disclaimer: This post was done in collaboration with Tinybird. But we didn't favor Tinybird in any way, and we didn't hide the parts where AWS-native holds up fine. Everything is measured, and the numbers are what they are.
The Problem: AWS Analytics Feels Slow By Default
Principles first: Athena (generally a great service btw, can't argue with that) runs a new query execution for every request. There's no dedicated compute sitting warm, waiting for this.
That's the tradeoff behind Athena's pricing:
- you pay per query, not per hour, but
- the cost of that is a cold start every time.
Athena does sell provisioned capacity that keeps compute warm for an hourly price, but we didn't use it here: the numbers below are the on-demand path. We're generally Serverless-first fans, so this isn't a deal-breaker for us, but it's a tradeoff we're aware of. Having compute sitting idle for most of the time is not something we're willing to pay for.
So, we measured it against our own dashboard queries instead of trusting the reputation:
- same four queries
- both backends
- every ~80 seconds for 15 minutes straight
- no caching
The full numbers are two sections down. TL;DR: Athena never answered under 11 seconds, Tinybird never went over 2 (even on the free tier, which is much less powerful than the paid tiers).
An 11-to-16-second wait doesn't work well for a dashboard someone actually looks at regularly like we do. To fix that on AWS-native, you'd add a cache layer yourself: DynamoDB or ElastiCache in front of Athena, refreshed on a schedule or on write.
That's not a simple, one-time setup either. Cache invalidation, refresh timing, and staleness windows become your problem to own, not something the platform hands you.
Generally, we want less operational overhead, not more. Also, we want to have it cheap; this would get expensive fast.
Tinybird skips this entirely. A SQL Pipe published as an endpoint is an API (this is really neat I have to say), backed by ClickHouse underneath, and it answers in about a second, consistently. We didn't need an application cache for the Tinybird side: this implementation answers in about a second without one, and there's nothing to keep warm or invalidate. That is the layer we'd otherwise have had to build ourselves in front of Athena.
Two Pipelines, One Dashboard
Here's what each side actually looks like end to end.
AWS-native: Not complicated, but not simple either. A lot of moving parts that need to be "glued" (ba dum tss) together.
- CloudFront real-time logs stream into Kinesis.
- A Lambda function reads each record, writes newline-delimited JSON to S3.
- A Glue crawler scans that S3 prefix on a schedule and updates the Glue Data Catalog.
- Athena queries the catalog directly (no separate database, no copy of the data).
Tinybird: Fewer parts to stitch together and much less to maintain.
- The same Kinesis stream feeds a Lambda function, a thin forwarder that reshapes each record and calls the Tinybird ingest API.
- Tinybird stores it in a Data Source, backed by ClickHouse.
- Four SQL Pipes turn the raw rows into the four shapes the dashboard needs (pageviews, top pages, top referrers, unique visitors), and publishing each of those pipes as an endpoint is what turns it into an HTTP API.
Both dashboards show the same numbers: pageviews, unique visitors, top pages, and hourly traffic. Unique visitors are deduplicated by hashed IPs on both sides, so we never store a raw IP. That approximates what Plausible does with a fingerprint. Both sides approximate the same way, so the comparison between them holds even where the absolute visitor count differs from Plausible's.
We built one frontend that queries both backends and renders them next to each other, so every number below came from the same UI hitting two different APIs.
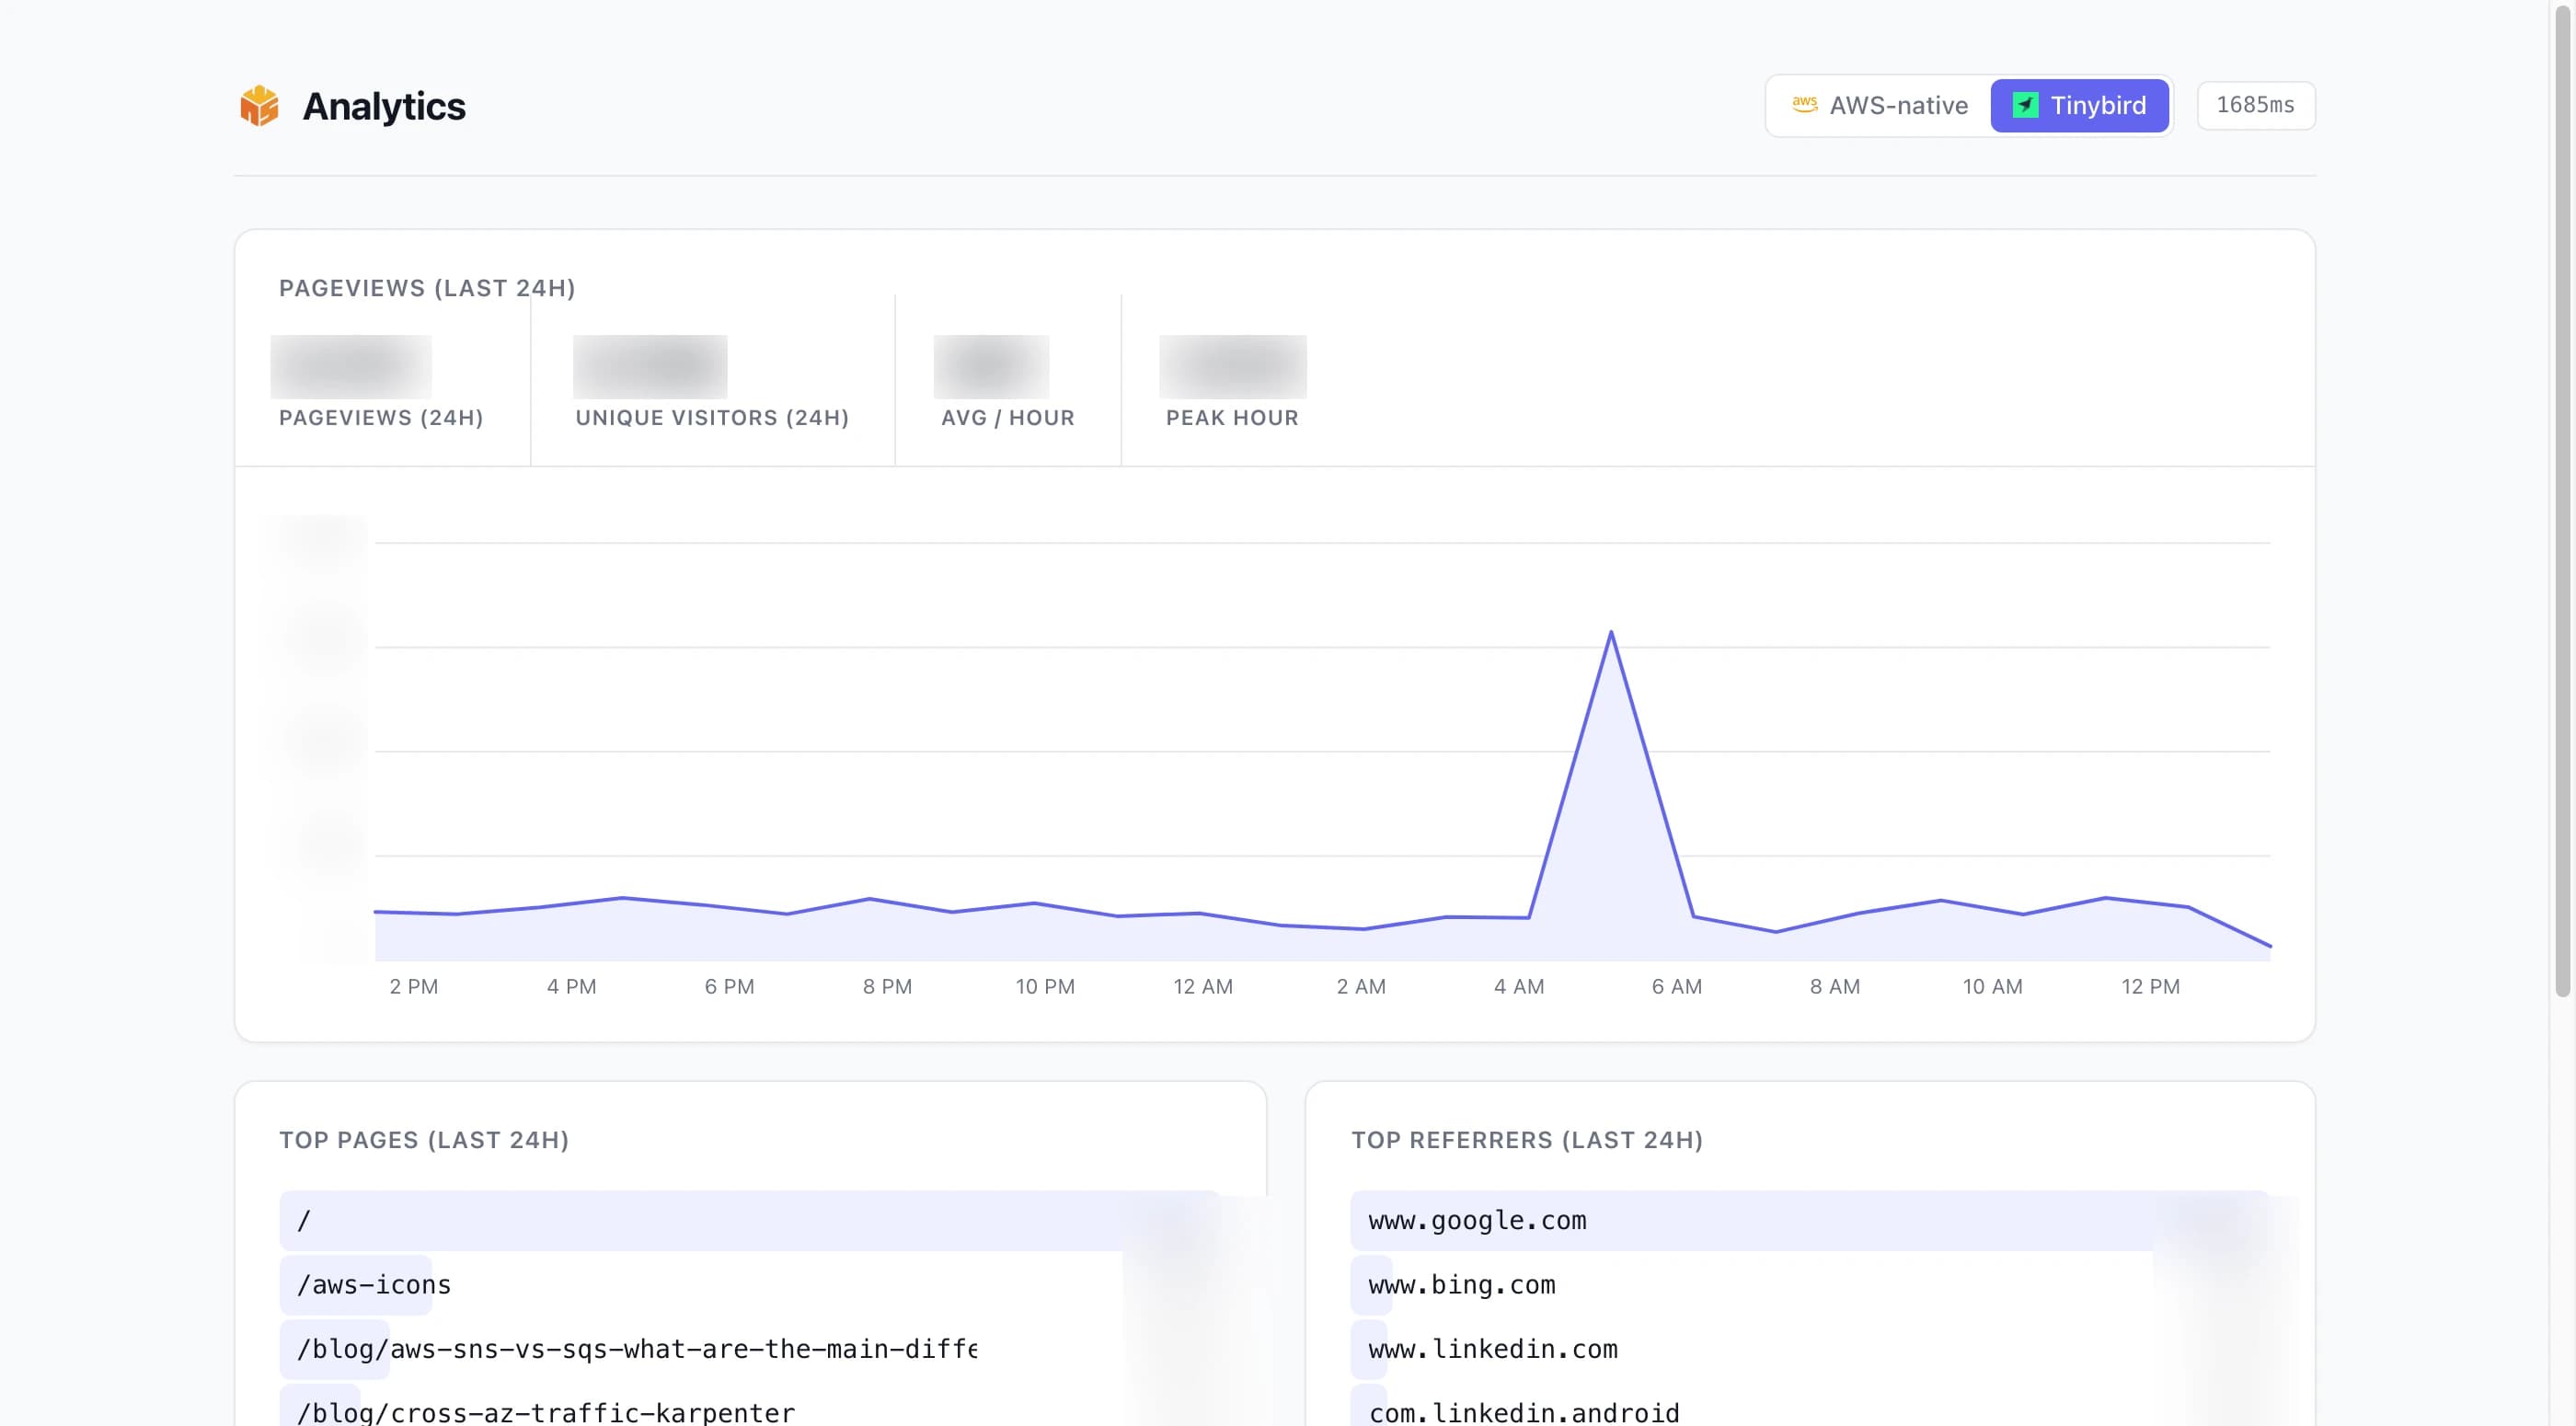
This is the Tinybird side of that real dashboard, in production right now.
We blurred the actual traffic numbers (this is not a marketing blog for our own benefit) but the layout, the query latency badge in the top right, and the toggle between the AWS-native and Tinybird views are exactly what we look at.
Query Latency: Measured
We didn't want to guess at Athena's reputation for being slow, so we hit both backends with the same four dashboard queries every ~80 seconds for 15 minutes and logged every response. Four queries per round, about 12 rounds, so 48 calls per backend. Nothing was cached or warmed up beforehand.
- Athena: about 11.3s to 16.1s, averaging about 12.5s.
- Tinybird: about 0.8s to 1.5s, averaging about 1.0s.
One caveat on that Athena number, because it works against our own setup: the writer Lambda flushes one S3 object per Kinesis batch, and at our log volume those batches are small, so the raw prefix holds a lot of tiny files (195,726 objects for 280 MiB, about 1.5 KB each). Athena opens each of those per query, so part of the 12.5s is our file layout rather than Athena itself. Compacting the prefix would bring it down.
Free-tier disclaimer: The Tinybird numbers above come from the free tier, which runs on shared compute with 0.25 vCPU and one thread per request. That's what our plan actually gives us, so that's what we measured. Paid tiers change the compute, not just the quota: Developer starts at 0.5 vCPU with 2 replicas and scales to 8, and SaaS goes up to 32 vCPU with 4 to 16 threads per request. We don't have paid-tier numbers, so we're not going to guess at them. The takeaway is that about 1s is what we get on the free plan, not the platform's floor.
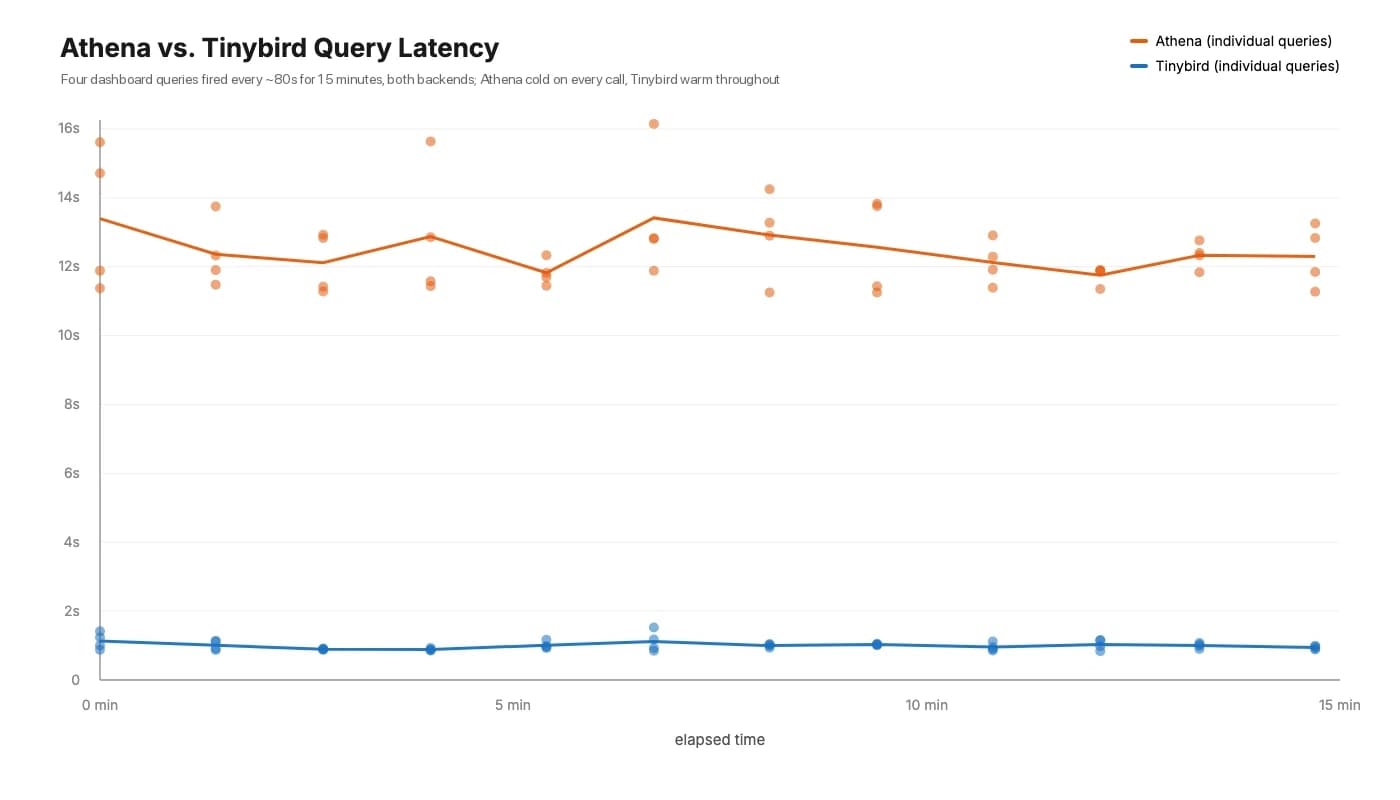
Each dot is one query; the line is that round's average across the four.
No fast Athena run showed up, not once in 48 tries.
Every call spun up a new query execution, and the 11-to-16-second band held steady the entire 15 minutes, whether it was call 1 or call 48. Tinybird stayed under 2 seconds throughout, consistently an order of magnitude faster, because ClickHouse is running as a warm, dedicated query engine the whole time, not spinning up execution per request.
Schema Changes: The Real Cost of "Just Add a Column"
Adding a field sounds trivial until you've done it against a production pipeline. So we ran the identical schema change on both backends, live, and timed every step.
We added is_mobile, derived from the User-Agent string that was already in every row.
No new CloudFront real-time log field needed, which meant we were timing the schema-change mechanics themselves, not CloudFront's log propagation delay.
| Step | AWS-native | Tinybird |
|---|---|---|
| Add field to writer/forwarder Lambda | code change + deploy | code change + deploy |
| Test against real data before prod | staging table you build and maintain yourself | Data Branch from last partition: 5s |
| Apply schema change | Glue crawler re-run required | ALTER TABLE in branch: 3s |
| Promote to prod | same crawler run, no separate promote step | deploy to prod: 2s |
| New field queryable end-to-end | manual crawler trigger, ready in 269s (about 4.5 min) | about 10s total, tested against real data first |
Same field and source data, both backends already taking live traffic.
The AWS-native side isn't slow because of the ALTER itself but because on this path a crawler run is what refreshes the Glue Data Catalog, and testing the change against real data first means standing up your own staging table, with no equivalent to a Data Branch.
Partition Projection sidesteps the crawler entirely, which we get to below, but it doesn't give you a place to test the change first either. You either trust the change and push it, or you build your own staging table to test it first.
Tinybird's Data Branch is a copy of the workspace seeded from the last real partition of production data.
You test the ALTER there, against actual rows, then deploy the project to prod once you've seen it work.
No backfill and no separate migration tooling needed. That's also genuinely nice, no separate tooling to learn and maintain.
Generally speaking, this is a workflow difference and not just a speed difference: one side hands you a safe place to test schema changes against real data, the other leaves you to build and maintain one.
Both Pipelines Live in the Repo
Everything on both sides is code in the same repository, not something clicked together in a console.
The AWS side is SST/Pulumi TypeScript in infra/: the Kinesis stream, the S3 writer Lambda, the Glue crawler and database, the Athena workgroup, and the router that fronts the dashboard.
The Tinybird side is a folder next to it:
tinybird/
    datasources/pageviews.datasource
    pipes/pageviews_stats.pipe
    pipes/top_pages.pipe
    pipes/top_referrers.pipe
    pipes/unique_visitors.pipe
Each file declares what it is.
- The datasource carries its schema, engine, and sorting key.
- Each pipe carries the SQL for one dashboard query.
That's easier to show than to describe. The datasource is the table:
SCHEMA >
    `timestamp` String `json:$.timestamp`,
    `c_ip` String `json:$.c_ip`,
    `sc_status` String `json:$.sc_status`,
    `cs_method` String `json:$.cs_method`,
    `cs_uri_stem` String `json:$.cs_uri_stem`,
    `time_taken` String `json:$.time_taken`,
    `cs_user_agent` String `json:$.cs_user_agent`,
    `cs_referer` String `json:$.cs_referer`,
    `cs_uri_query` String `json:$.cs_uri_query`,
    `c_country` String `json:$.c_country`,
    `is_mobile` String `json:$.is_mobile` DEFAULT ''

ENGINE "MergeTree"
ENGINE_SORTING_KEY "timestamp"
Schema, JSON mapping from the incoming payload, table engine, and sorting key, in one file that lives in the pull request.
The is_mobile line with its DEFAULT '' is the schema change from earlier.
That one line is the migration.
And here's a full pipe, unique_visitors, with only the shared bot filter elided (about 20 lines of user-agent regex that both backends run identically):
NODE endpoint
SQL >
    %
    SELECT uniqExact(c_ip) AS visitors
    FROM pageviews
    WHERE toDateTime(toFloat64OrZero(timestamp)) > now() - INTERVAL 24 HOUR
        AND ...shared page-load and bot filter...

TYPE endpoint
TYPE endpoint is the whole difference between a query and an API.
Deploy the project and /v0/pipes/unique_visitors.json answers, with token auth and JSON output, because the file said endpoint.
There's no handler, no router entry, no serialization code, and no separate deploy for the API layer.
The is_mobile field we added in the section above lives in the datasource file now, reviewable in the same pull request as the query that reads it.
Prod and dev share one workspace and split by name: the datasource is pageviews in prod and pageviews_dev in dev, and the pipes carry the same suffix.
Our infra code picks both from the SST stage, so a dev deploy can't write into the prod datasource.
That contrast is the same theme as the schema section. On the AWS-native path the real schema lives in the Glue Data Catalog, which a crawler rewrites at runtime. On the Tinybird side the datasource file is the source of truth, and nothing overwrites it behind your back.
How the Dashboard Talks to Both Backends
Neither side exposes a token to the browser: it calls our own Lambda, which holds the credential and proxies to Tinybird or runs the Athena query, then returns JSON.
Tinybird's four pipes are four plain HTTP endpoints, no resolver or ORM in between. Another service needing "top pages, last 24h" just calls the same URL with a scoped token.
Inside that Lambda, the two backends are not the same amount of code. Tinybird is a fetch:
const url = `${TINYBIRD_API_URL}/v0/pipes/${pipe}.json`;
const response = await fetch(url, {
    headers: { Authorization: `Bearer ${TINYBIRD_TOKEN}` },
});

const json = await response.json();
return json.data;
Athena is a query execution you have to babysit:
const start = await athena.send(
    new StartQueryExecutionCommand({
        QueryString: sql,
        WorkGroup: process.env.ANALYTICS_ATHENA_WORKGROUP,
        QueryExecutionContext: { Database: process.env.ANALYTICS_GLUE_DATABASE },
    }),
);
const queryExecutionId = start.QueryExecutionId!;

const deadline = Date.now() + 25_000;
while (Date.now() < deadline) {
    const execution = await athena.send(new GetQueryExecutionCommand({ QueryExecutionId: queryExecutionId }));
    const state = execution.QueryExecution?.Status?.State;

    if (state === 'SUCCEEDED') break;
    if (state === 'FAILED' || state === 'CANCELLED') {
        throw new Error(execution.QueryExecution?.Status?.StateChangeReason || `Athena query ${state}`);
    }
    await new Promise((resolve) => setTimeout(resolve, 500));
}

const results = await athena.send(new GetQueryResultsCommand({ QueryExecutionId: queryExecutionId }));
Then you still map ResultSet.Rows into objects yourself, because every column comes back as VarCharValue strings with the header in row 0.
To be fair to Athena: that's the shape of its API, not sloppiness on our side.
Athena is an asynchronous query service, so start-poll-fetch is the contract, and the 500ms poll interval is also why our measured latency can't go below one poll cycle.
It's still code we own, test, and keep working, against a fetch that has nothing to maintain.
Ingest works the same way in reverse: the forwarder Lambda reshapes each Kinesis record and POSTs it to Tinybird's ingest API.
Consuming the endpoints is fetch, Tinybird's SDK, whatever you want; we used fetch.
What the Glue Crawler Actually Costs at Scale
We ran the crawler once a day for this project, and at that frequency it's cheap.
We priced it at list: UsageQuantity in DPU-hours from Cost Explorer, times Glue's list price ($0.44/DPU-hour).
Two real runs: 0.072 DPU-hours for a routine scheduled run, 0.209 for a manual trigger during the schema-change test above.
Glue bills hourly with a 10-minute minimum on 2 DPUs, so both hit the same ~$0.15 floor regardless of what they actually did.
A run costs the same whether it finds one new file or a million, so cost tracks how often you run it, not how much data you have. At our volume, roughly 25,000 to 30,000 pageviews a month, frequency is the only lever that moves the number:
| Frequency | Runs/day | Monthly (at the ~$0.15/run floor) |
|---|---|---|
| Daily (what we ran) | 1 | about $4.50 |
| Hourly | 24 | about $108 |
| Every 15 min | 96 | about $432 |
| Every 5 min ("live" feel) | 288 | about $1,296 |
Going from once a day to something that approximates Tinybird's constant freshness is 288x the cost, and five minutes is as fast as it goes: Glue's own scheduler bottoms out at a 5-minute interval. Nothing about that scales with data volume: the crawler is a batch discovery mechanism, not something designed to be polled.
Skipping the crawler: you can hand-write the Glue Data Catalog table once and never run a crawler at all. That trades auto-discovery for an implicit schema you own: new fields land in S3 but not in the table until you
ALTER TABLE ADD COLUMNSyourself, and Athena quietly ignores anything undeclared instead of erroring. Fine if your schema barely changes. A real tradeoff the moment it does.
TL;DR: the crawler is cheap once a day (~$4.50/month) but bills per run, not per byte. Polling it every 5 minutes for Tinybird-like freshness costs $1,296/month for no extra data: frequency, not volume, is what breaks the budget.
The Rest of the Bill, Measured
The crawler gets the attention here because it's the piece that misbehaves under frequency, but it isn't the biggest line item in the pipeline. We pulled the rest from Cost Explorer usage quantities for the same period and priced them at list, same as above:
| Line item | Measured usage (9 days) | List price |
|---|---|---|
| Kinesis on-demand stream | 134 stream-hours, 0.4 GB in | $0.04/stream-hour, $0.08/GB |
| Glue crawler | 1.0 DPU-hour | $0.44/DPU-hour |
| Athena scans | 391.8 MB per dashboard query | $5/TB scanned |
| S3 storage | 67 GB-hours, about 0.6 GB | $0.023/GB-month |
| Lambda writer/forwarder | ~1.0M invocations, 56k GB-s | $0.20 per 1M requests, $0.0000133 per GB-s |
An always-on Kinesis stream is 720 stream-hours a month, which lands at about $28.80. That's more than six times the daily crawler cost, and it's the one line item both setups share: the same stream feeds the AWS-native writer and the Tinybird forwarder, so it cancels out of any comparison between the two backends.
The Lambda row is the other half of shared ingestion, and we had to get it by subtraction rather than read it off directly: both functions are ARM64 and run once per Kinesis batch, so they show up as a step in the account's ARM request count for exactly the days the pipeline was up. Over that window it's about a million invocations and 56,000 GB-seconds, which at list price comes to about a dollar. The two dashboard query endpoints are a rounding error inside that number, so the writer and forwarder are effectively all of it, and it's metered per invocation, not per dashboard request.
Athena is the surprise in the other direction. Each dashboard query scans 391.8 MB, which is about $0.0019 at $5 per TB scanned. Small partitions keep it there, and at a few hundred dashboard queries a month it stays under a dollar.
So the shared ingestion path (the Kinesis stream and the Lambda that reads it) costs about $32/month before either backend does any work, and $28.80 of that is the stream itself. The AWS-native-specific pieces we measured on top of that, the S3 prefix, the ~$4.50/month crawler and the Athena scans, are the cheap ones at this volume. What makes the AWS-native side expensive isn't the meter, it's the maintenance, and the crawler frequency table above is where that flips.
TL;DR: shared ingestion (Kinesis plus the Lambda that reads it) runs about $32/month no matter which backend you query it with. Athena's scans and the crawler's daily cost are both cheap at this volume: the AWS-native tax is operational, not on the bill.
Athena Partition Projection: The AWS-Native Alternative We Tested
There's a way around the crawler entirely: Athena Partition Projection. Instead of crawling S3 to discover partitions, you configure a template that computes partition locations from naming conventions you control (year, month, day, hour, for us). No crawler run, no wait: partitions are queryable the moment they exist.
Catch: with projection on, Athena ignores the Glue Data Catalog's partition metadata for that table, and SHOW PARTITIONS won't list them.
That's the point for us, but a surprise if you expect the catalog to stay the source of truth.
We tested it against real data: a separate table, raw_pp_test, same schema and SerDe as production, same S3 prefix, TBLPROPERTIES with projection.enabled=true.
Queried it, confirmed the result, dropped the test table.
Production untouched.
Immediately after creating the table, no crawler run, no wait:
SELECT
    count(*)
FROM
    raw_pp_test
WHERE
    year = '2026'
    AND month = '09'
    AND day = '09'
    AND hour = '13';
That counted 3,821 rows: exactly the cost problem above, solved, since no crawler runs means no frequency-to-cost coupling.
It doesn't solve schema discovery, though.
A genuinely new field still needs a manual ALTER TABLE ... ADD COLUMNS (4 seconds, fast, but manual, and easy to forget).
Our take. Worth using if you're staying AWS-native: DDL-only setup, kills the crawler-frequency trap completely. It doesn't replace what Tinybird gives you out of the box, though: still no auto schema discovery, partition layout fixed in advance (fine for time-based partitions like ours, worse for anything less predictable), and no effect on Athena's cold-start latency. Real progress on one pain point, not a reason to change the recommendation below.
Where This Leaves the Two Setups
Neither setup is wrong; they trade different things.
| Aspect | AWS-native | Tinybird | Winner |
|---|---|---|---|
| Latency | ~12.5s avg, cold start | ~1.0s avg, warm | 🏆 Tinybird |
| Cache | a cache layer you'd build | none needed for this impl | 🤝 Tie |
| Schema | crawler re-run, 4.5 min | branch + deploy, 10s | 🏆 Tinybird |
| Freshness | continuous w/ Projection | continuous | 🤝 Tie |
| Crawler cost | $0 with Projection | n/a | 🤝 Tie |
| Ops work | cache, crawler, DDL | vendor, privacy review | 🏆 Tinybird |
| Data control | stays in your AWS | leaves your account | 🏆 AWS-native |
| Vendor | none new | new dependency | 🏆 AWS-native |
AWS-native: full control, no new vendor, every piece standard AWS. Cost: recurring upkeep, a cache layer you build and maintain, plus either a crawler interval you can live with (and its freshness lag) or Partition Projection with a manual DDL step per schema change.
Tinybird: sub-2-second endpoints from first deploy, no additional application cache needed for this implementation, a real branch-and-test workflow for schema changes. Cost: an external data processor with its own plan limits, and a privacy/data-residency review before real visitor data flows through it.
Price is a wash: same shared Kinesis stream either way, and our volume ($0 on Tinybird's free tier) barely dents the AWS-native-only cost of a ~$4.50/month crawler and sub-dollar Athena scans.
The asymmetry is upkeep: AWS-native keeps costing you work every month, Tinybird asks for a review up front and less ongoing work after. That's what decided it for us.
If you're staying AWS-native, Partition Projection is still worth doing as a real fix for the crawler cost specifically. If you want to skip building the cache layer and get a branch-and-test workflow for schema changes, that's what pushed us toward Tinybird for this project, and it's the first thing we'd reach for next time.
What the Tiers Give You at Our Scale
"Free tier" usually means toy numbers, so here's what it's actually carrying for us: 280 MiB of raw logs over four days (195,726 objects), about 70 MiB/day, 2 GB/month uncompressed. Hold that against the storage column below.
| Tier | List price | Storage | Compute | Requests | Branches |
|---|---|---|---|---|---|
| Free | $0 | 10 GB | 0.25 vCPU, 1 thread per request, shared | 1,000 per day | included |
| Developer | from $49 per month | 25 GB | 0.5 to 8 vCPU, 2 replicas (illustrated config: 0.5 vCPU at $49) | unlimited | 3 |
| SaaS | custom, from 500 GB | 500 GB+ | up to 32 vCPU, 4-16 threads per request | unlimited | 6 |
| Enterprise | custom | bottomless | unlimited vCPU, dedicated infrastructure | unlimited | 15 |
10 GB free storage covers five months of raw retention before ClickHouse even compresses it, and our dashboard traffic never nears 1,000 requests/day. Ingest and storage are cheap; serving is what's metered.
So the tier that matters depends on who's asking. A dashboard a few people open, like ours, fits free. A real user base or an API other services call outgrows it fast: 1,000 requests/day and a quarter-vCPU, one thread per request, is a hard concurrency ceiling. Developer removes the request cap (2 replicas, 25 GB, from $49/month, where the configuration we illustrate is 0.5 vCPU and it scales to 8); SaaS starts at 500 GB and goes up to 32 vCPU for real parallelism; Enterprise removes the rest. Overage is $0.058/GB storage and $0.0002/vCPU-second, so outgrowing a tier is a step, not a cliff.
Our traffic is small and fits free. Bigger traffic still gets a predictable monthly number, as long as you read it off storage and compute and not off request count alone.
Wrap-Up
We built the same dashboard twice so we wouldn't have to guess. AWS-native works, and if you're already deep in it, nothing here says you have to leave: Partition Projection removes the crawler cost trap on its own. It's just more yours to maintain, and the numbers above are what that upkeep costs. Tinybird was faster, less work to run, and free at our volume. The only thing we gave up was one more vendor in the architecture, which is a review you do once rather than work that comes back every month. We picked Tinybird for this project, and that's the call we'd make again.
If you want to build the same thing, start at the ingestion half, since both backends here sit on the same stream. Tinybird's own guide to ingesting from Amazon Kinesis covers that path end to end; the AWS-native side is the writer Lambda, the S3 prefix, and the Glue table from the sections above. Either way you end up with the dashboard from this post.
Thanks to Tinybird for sponsoring this post and letting us run it against real production traffic.