DynamoDB Warm Throughput: How to Avoid Throttling on a New Table


A brand-new on-demand DynamoDB table can handle about 4,000 writes per second. After that, DynamoDB throttles the rest. AWS says on-demand tables autoscale, eventually. I wanted to know how long "eventually" is, and what it costs to skip the wait, so when you deploy to production, there are no surprises.
TL;DR: a new table stalled at 4,000 writes/s and took about 16 minutes of throttling to grow. Pre-warmed to 10,000, it took every step up to 12,000/s with zero throttled writes.
In a 3.5-minute step test in August 2026, a fresh table took every write up to 4,000/s, then stayed flat even when I sent 8,000/s. On-demand does grow, just not that fast. This time I tested three ways to get past it before the traffic arrives:
- Do nothing and let on-demand capacity grow the table.
- Create it provisioned, then switch to on-demand.
- Pre-warm it with
WarmThroughput.
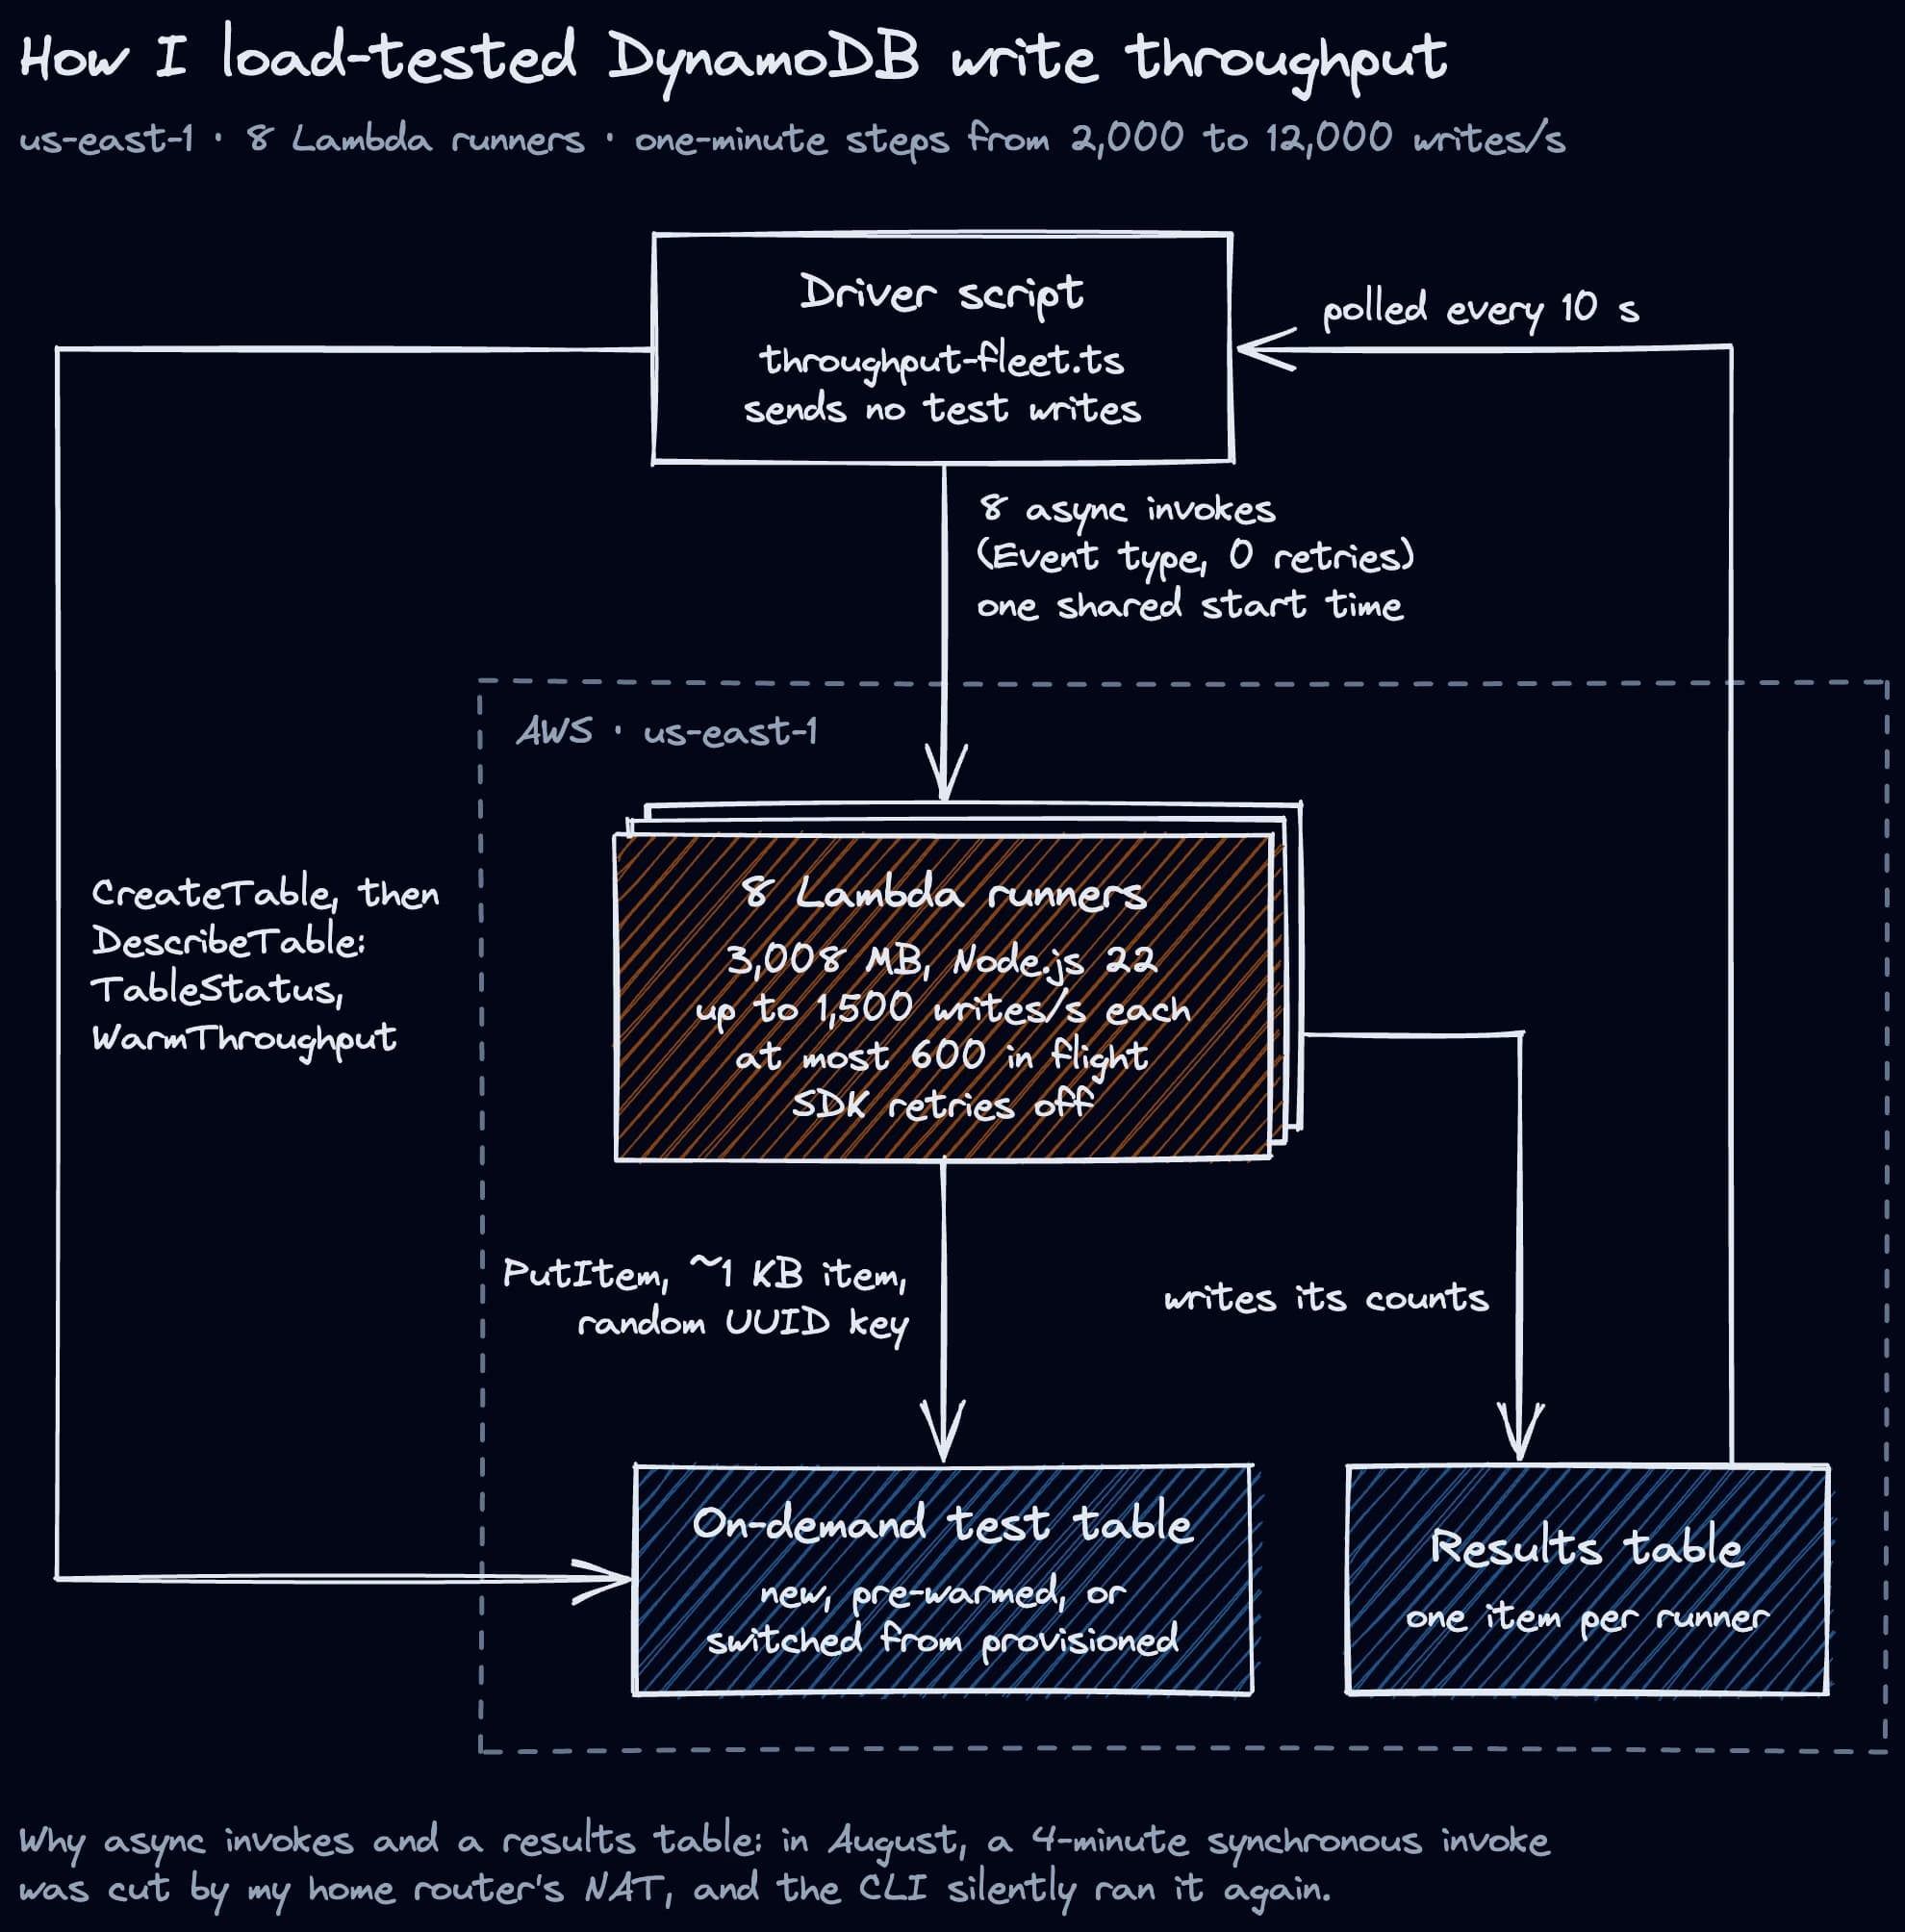
All three ran on the same setup:
- us-east-1, one AWS account
- eight Lambda runners sending ~1 KB
PutIteminserts on random keys, SDK retries off - a step test from 2,000 to 12,000 writes/s, one minute per step
- retests of the grown table after 1 and 24 hours, and of the pre-warmed table after 24 hours
Disclaimer: I'm a solo developer and I build DynoTable, a desktop client for DynamoDB with real SQL & your AI agent.
The Problem: On-Demand Starts at 4,000 Writes/s
Every on-demand table has a warm throughput. It's the rate DynamoDB says the table can take instantly. A new table starts at 4,000 write units and 12,000 read units per second.
With items under 1 KB, one write is equal to one write unit.
For most tables, it never matters. It does matter when launching a high-load service in production, running a migration, or backfilling a new table at full speed.

DynamoDB on One Page (No Fluff)
Master NoSQL on AWS. Our DynamoDB cheat sheet covers data modeling, partitioning, and access patterns - the practical knowledge you need.
HD quality, print-friendly. Stick it next to your desk.
Doing Nothing
As expected, the new table served every write up to 4,000/s and throttled the rest.
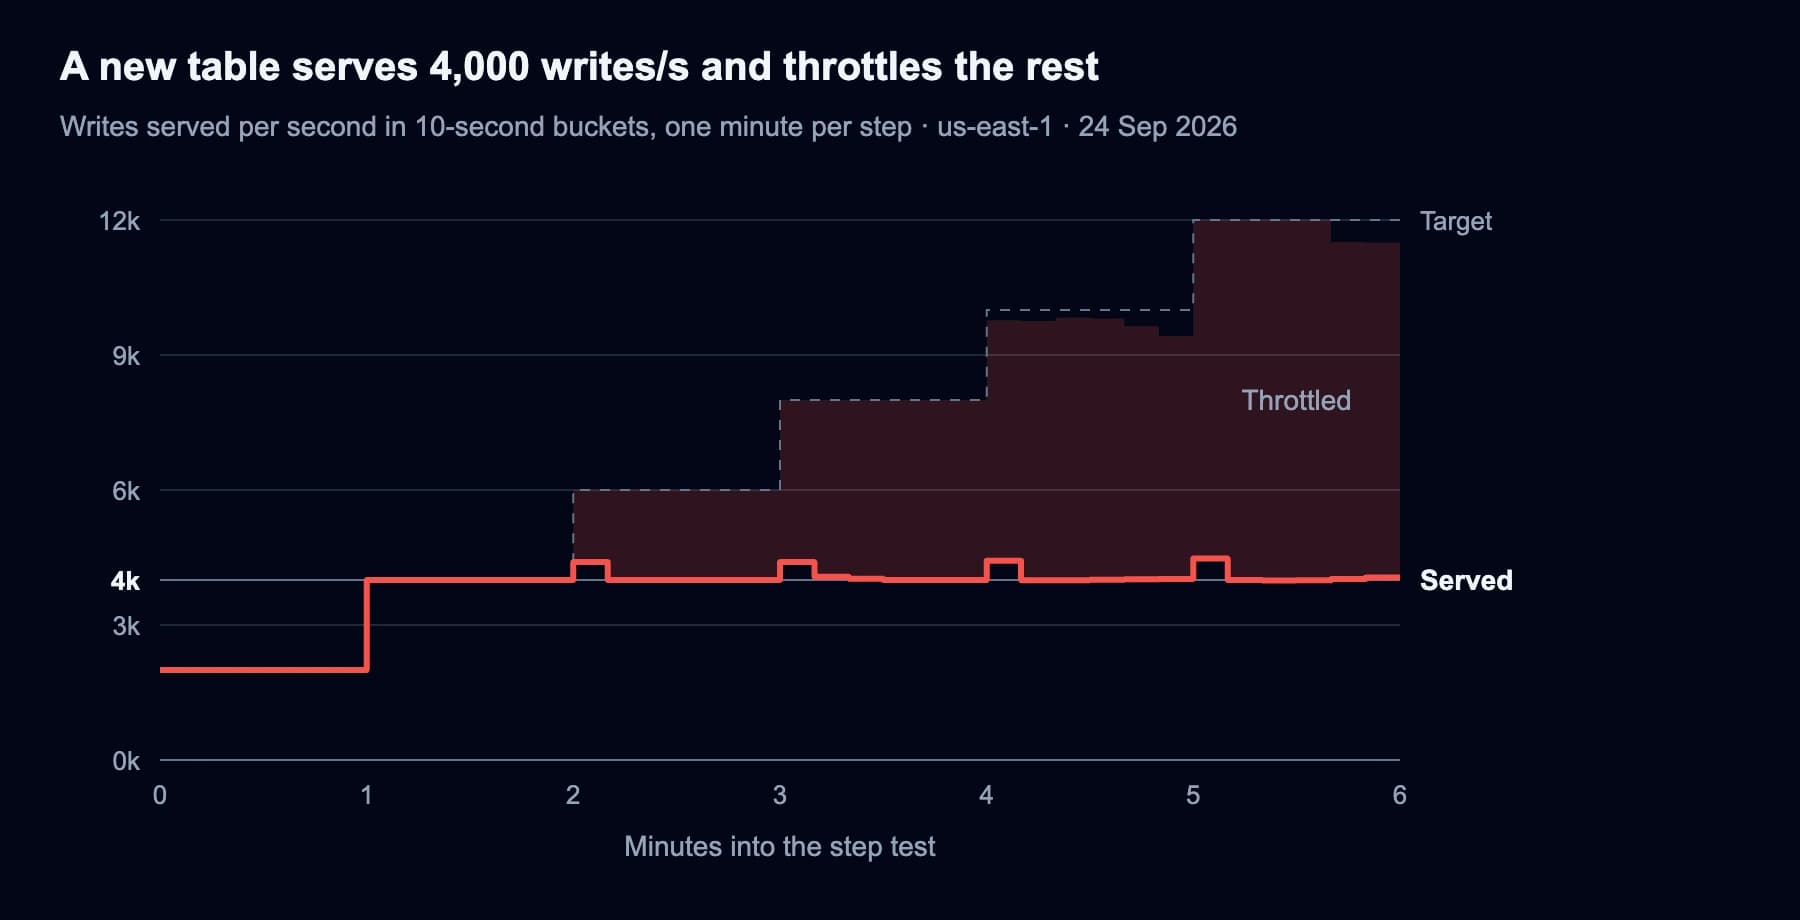
Each step above 4,000/s averaged 4,400–4,480/s over its first 10 seconds, then settled at about the documented 4,000.
The extra is burst capacity. AWS says DynamoDB keeps up to five minutes of unused capacity for short spikes. However my new table had much less: 4,000 to 4,800 extra writes per step, used up in the first 10 seconds. Waiting for 30-40 seconds didn't add more, so don't rely on it much.
What Throttling Looks Like From Your App
DynamoDB rejects the extra writes and keeps answering the rest at full speed. In my previous run, p50 latency of the accepted writes stayed at 4 to 5 ms on every runner that kept pace, even while other writes were throttled.
The rejection is an HTTP 400 with this message:
ThrottlingException: Throughput exceeds the current capacity of your table or index.
DynamoDB is automatically scaling your table or index so please try again shortly.
If exceptions persist, check if you have a hot key:
https://docs.aws.amazon.com/amazondynamodb/latest/developerguide/bp-partition-key-design.html
Three things to check before launch:
- Retries: a client that only retries 5xx errors drops these writes. The AWS SDKs retry throttling errors by default, but a custom retry policy might not.
- Alarms: a monitor that only watches 5xx errors shows a green service while writes bounce. Alarm on
WriteThrottleEventsfor the table and for each GSI instead. The table-level metric doesn't count index throttles. - The hot-key hint: my keys were random UUIDs, so there was no hot key. On a new table, the first suspect for this message is the 4,000 writes/s limit.
Letting It Grow: 16 Minutes of Throttling
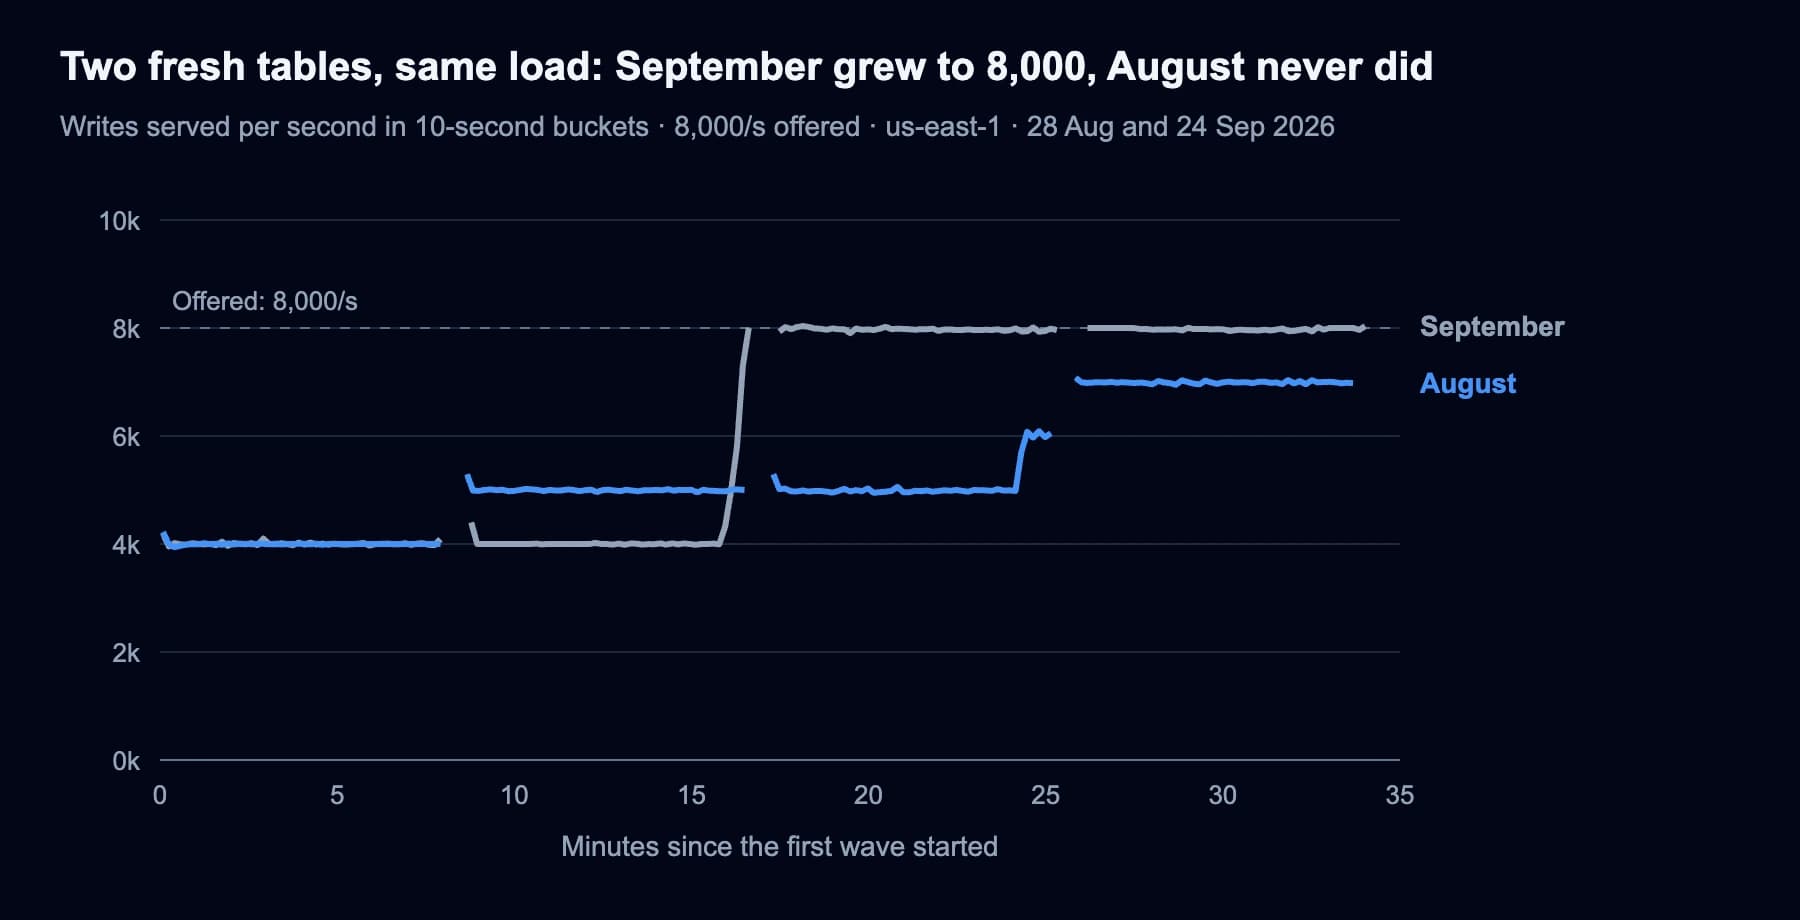
For this test I sent 8,000 writes/s to a new table in four 8-minute waves, with gaps of about 40 seconds between them. The "waves" are just a limit of my setup, since my runners were deployed as lambdas that time out after 10 minutes.
For about 16 minutes, through the first and most of the second wave, it served 4,000/s and throttled the rest. At the end of the second wave it climbed from 4,300 to 8,000/s. Waves three and four ran at about 7,975/s, with 0.2 to 0.3% still throttled.
A similar test run in August, at the same rate and region, showed different results. It grew in steps of about 1,000/s: about 5,000 from minute 9, about 6,000 from minute 24, about 7,000 from minute 26, and it never reached 8,000 in 34 minutes. Yan Cui saw a similar plateau near 7,000 in 2019. So I would not rely on the autoscaling timing and steps as AWS might change how it works internally.
Interestingly DescribeTable didn't show any of this while it happened.
It reported 4,000 writes/s warm after every wave, including the two that ran near 8,000.
Switching From Provisioned
Before warm throughput existed, the usual trick was to create the table in provisioned mode at the capacity you need, then switch it to on-demand. AWS says a table provisioned at 8,000 WCU "will continue to be able to sustain at least 8,000 write units/sec" after the switch.
I wanted to see if it was true.
I created a table at 10,000 WCU and switched it right away.
The switch took a few seconds (AWS says it can take several minutes).
DescribeTable showed 10,000 writes/s warm before and after.
It served every step up to 10,000/s with zero throttled writes. At the 12,000/s step it throttled 18,861 of the 688,515 writes sent, about 2.7%.
That matches the AWS wording: after the switch you get at least the provisioned level, and nothing above it is promised.
Billing note: AWS bills provisioned capacity by the hour. This table was provisioned for less than a minute, but I still expected to pay for a full hour at 10,000 WCU: $6.50. That charge never appeared. Cost Explorer can't split capacity charges by table, so I can't prove the switch was free.
If your table is already provisioned at the peak you need, this is the obvious route.
Pre-Warming
Pre-warming is one extra flag on create-table:
aws dynamodb create-table --table-name my-table \
  --billing-mode PAY_PER_REQUEST \
  --attribute-definitions AttributeName=pk,AttributeType=S \
  --key-schema AttributeName=pk,KeyType=HASH \
  --warm-throughput WriteUnitsPerSecond=10000

aws dynamodb wait table-exists --table-name my-table
aws dynamodb describe-table --table-name my-table --query Table.WarmThroughput
The table was ACTIVE about 20 seconds after creation.
DescribeTable already showed warm throughput ACTIVE at 10,000, so on an empty table the pre-warm added no wait I could measure.
It served every step with zero throttled writes. That includes the 12,000/s step, 20% above what I set, where the switched table throttled 2.7%. At the top two steps it served 9,867 and 11,918/s because some of my runners hit their limit of 600 requests in flight. DynamoDB throttled nothing.
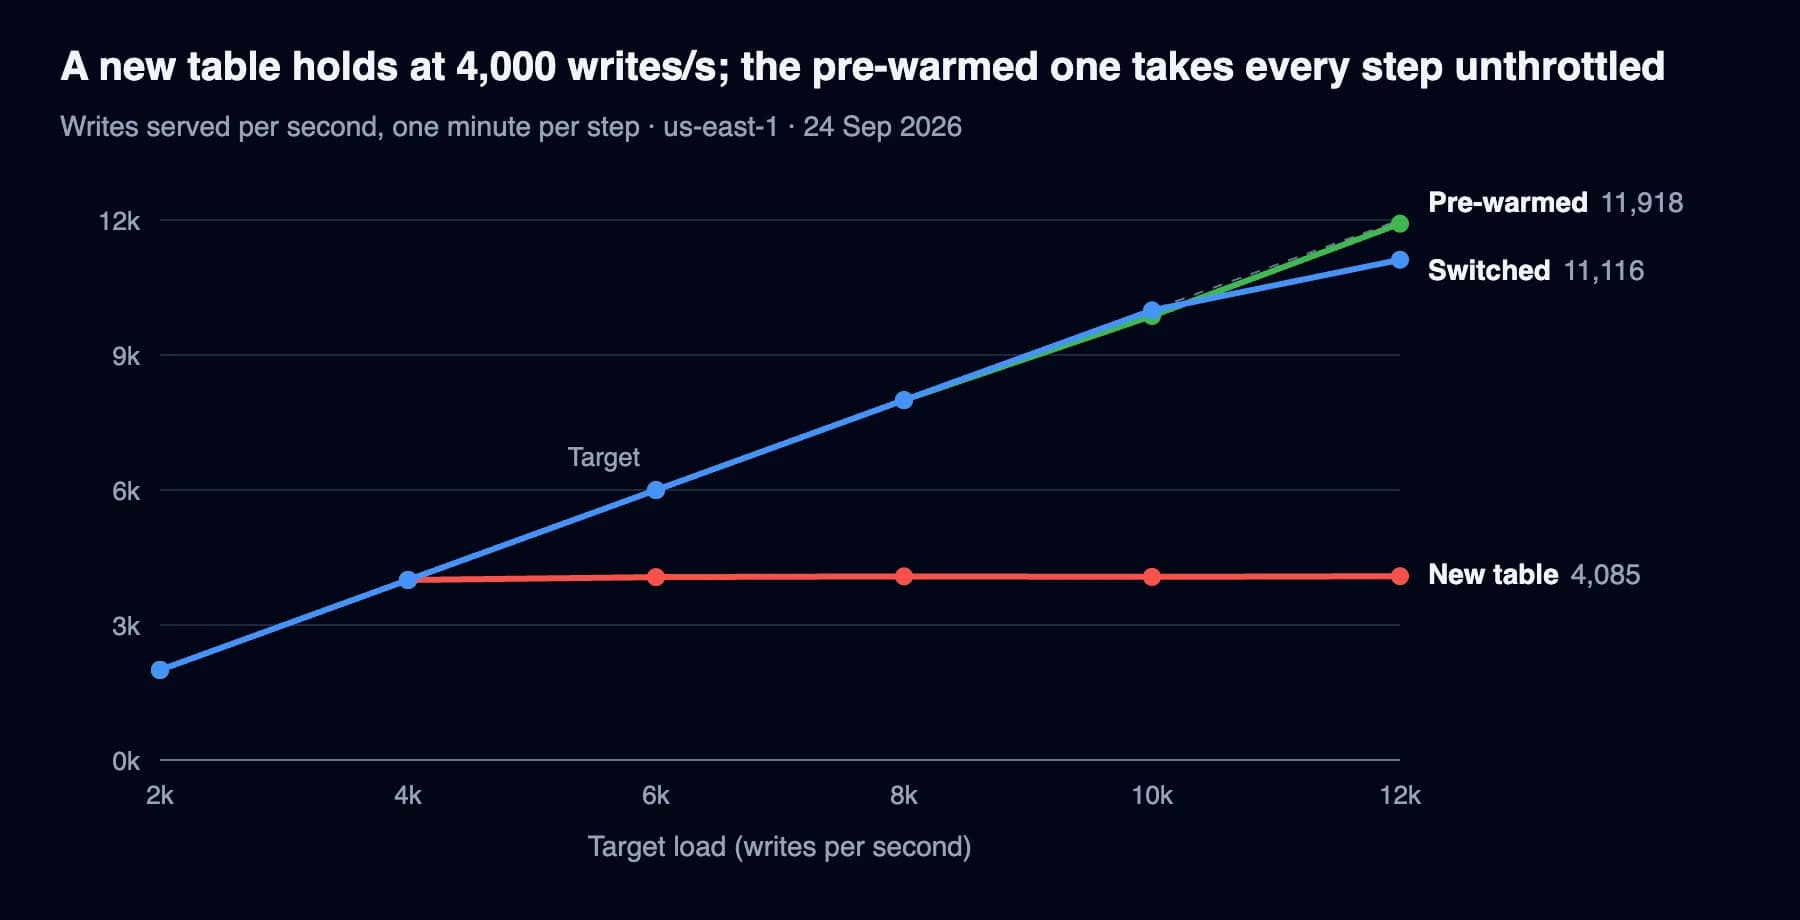
Each dot is the average writes served per second over one step.
For an existing table, update-table takes the same --warm-throughput flag.
Each global secondary index has its own warm throughput, which you set with --global-secondary-index-updates.
If reads matter at launch, the same flag takes read units too: --warm-throughput ReadUnitsPerSecond=20000,WriteUnitsPerSecond=10000.
AWS charges a pre-warm once, at the provisioned rate, for every unit above the current warm throughput: the WCU rate for writes, the RCU rate for reads. Going from 4,000 to 10,000 write units is 6,000 × $0.00065 = $3.90 at us-east-1 list price.
Free-tier note: my bill showed 6,000 WCU-hours that day, priced at $0. The always-free tier covers 25 WCU of provisioned capacity, about 18,000 WCU-hours a month, and my account had barely used it. On a busier account, expect to pay the $3.90.
TL;DR: one flag, about 20 seconds on a new table, $3.90, and the table takes 10,000 writes/s from the start.
Does the Warm-Up Last? Retested After 1 and 24 Hours
I re-ran the step test on the pre-warmed table 24 hours later, and on the grown table 1 hour and 24 hours after its growth test. No retest throttled a single write.
DescribeTable told the same story, with a lag.
The pre-warmed table read 14,000 warm a day later, above the 10,000 I set.
The grown table still read 4,000 when its last wave ended, then 15,777 an hour later and 21,136 a day later.
15,777 is just under twice the ~7,975/s the table had sustained. That looks like the "double the previous peak" behavior. The other two jumps, to 14,000 and 21,136, don't fit that pattern.
TL;DR: both warm-ups held for at least a day.
For a pre-warmed table, DescribeTable is a reliable check.
For a table that grew on its own, run a load test.
What About Reads?
This test was writes only.
In August I ran the same fleet against a second fresh table, with eventually consistent GetItem reads of about 1 KB.
I aimed as high as 16,000 reads/s. My runners could only send about 12,800/s, and DynamoDB served every one of them with zero throttled reads. Five of the eight runners were saturated, so that's where my client stopped, not DynamoDB.
That fits the defaults. An eventually consistent read of up to 4 KB costs half a read unit, so 12,762 reads/s used about 6,400 of the 12,000 read units a new table starts with. On paper, a new table takes up to 24,000 eventually consistent reads/s, or 12,000 strongly consistent ones.
Where This Leaves the Three Options
| Aspect | Do nothing | Provisioned, then switch | Pre-warm | Winner |
|---|---|---|---|---|
| Day-one throughput | 4,000/s | 10,000/s | 10,000/s | 🤝 Tie |
| Throttled at the 12,000/s step | ~65% until it grows | 2.7% | 0% | 🏆 Pre-warm |
| Time to be ready | 16+ min of throttling | create, then ~12 s switch | ~22 s from create | 🤝 Tie |
| Preparation cost | none, but throttled writes | not split out in my bill | $3.90 | No clear winner |
| Works on existing table | grows with traffic | yes, two mode switches | yes, one update-table | 🏆 Pre-warm |
Before a launch, I'd do four things:
- Estimate peak write and read units for the table and for each GSI. Units, not requests: a 2 KB write costs 2 write units, or 4 in a transaction.
- Set
WarmThroughputon the table and on every GSI whose peak is above its current warm throughput. - Check that
DescribeTableshows each valueACTIVEand at or above your target, including every index underGlobalSecondaryIndexes. Also check that no max-throughput setting or account quota (40,000 units per table by default, see the DynamoDB limits page) sits below your peak. - Load-test the table in the same region before real traffic arrives.
Limits of this test: one run per method, in one region and one account. Every step test ramped up over five minutes, so I never hit a fresh table with its peak rate all at once. No GSIs, small inserts on random keys. Bigger items cost more write units per write, a single partition caps at 1,000 write units/s, and real clients retry throttled writes, which adds more load.
My take. If you know your launch peak, pre-warm. It's one flag, it's cheap, and it was the only option with zero throttled writes at the 12,000/s step. If the table is already provisioned, switching works fine. Waiting for on-demand to grow under real traffic means throttled writes in production. You can grow it with your own load before launch, but my growth run took 32 minutes so account for that.