Table of Contents
Jump to a section
Integrating observability into systems is crucial for identifying and resolving issues swiftly, ensuring that systems are resilient and can recover quickly from disruptions.
This involves a focused approach on monitoring, alarming, and tracing to keep a close eye on system performance and health. By doing so, developers can preemptively address potential problems before they escalate, minimizing downtime and maintaining operational efficiency.
This article aims to explore how CloudWatch, Amazon Web Services' monitoring and observability service, can be effectively utilized to meet these observability challenges.
We'll cover how CloudWatch provides the tools necessary for detailed monitoring, setting alarms, and tracing application requests and transactions across your infrastructure. Through practical examples, we'll demonstrate how CloudWatch can be your ally in maintaining system stability and performance, ensuring that your applications run smoothly and reliably.
💡 📚 This article is a summary of the re:Invent talk by David Yanacek (Twitter,LinkedIn), Senior Principal Engineer at Amazon CloudWatch, focusing on the importance of building observability into systems to enhance their resiliency.
Diagnose issues
This chapter dives into how CloudWatch helps us figure out what's going wrong with our systems. It talks about the importance of looking closely at data, following what's happening across different parts of the system, and setting up alerts to keep an eye on system health. We focus a lot on using dimensions to get a better look into our metrics and how composite alarms can make handling problems a lot easier.
When we're trying to fix issues, we usually look at four main areas:
- Bad Dependencies: This part is about keeping an eye on errors across the whole server or specific webpages. Using CloudWatch Composite Alarms helps us catch and respond to these errors quickly.
- Bad Components: This section explains how to track down and isolate problems in parts of the system that work together. By following the trail of data and using service maps that show how services interact, we can figure out where things went wrong.
- Bad Deployments: Here, we talk about how to quickly detect that newly deployed code causes problems and how we can automatically respond to this. We look at how to tell apart different health indicators to get things back to normal fast.
- Traffic Spikes: This part deals with understanding why there's suddenly a lot more traffic than usual. We emphasize the need for detailed metrics and organized logs to manage these situations effectively.
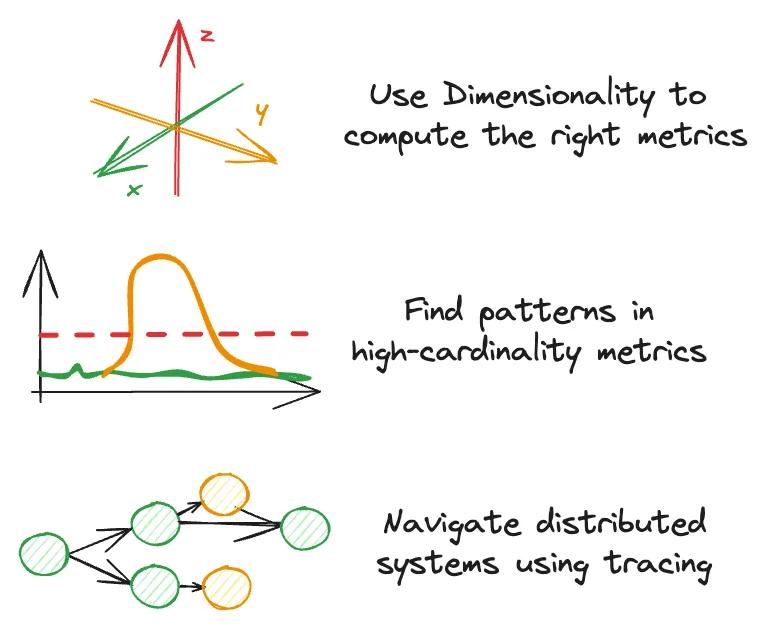
We also cover:
- Using dimensions to work out the right metrics: This means breaking down metrics in different ways to understand what's really going on.
- Finding patterns in detailed metrics: Here, we learn how to make sense of complex metrics to spot important trends.
- Getting around distributed systems with tracing: This is about summarizing and identifying issues in systems where many components work together.

Let's start with a real-world example of a web application.
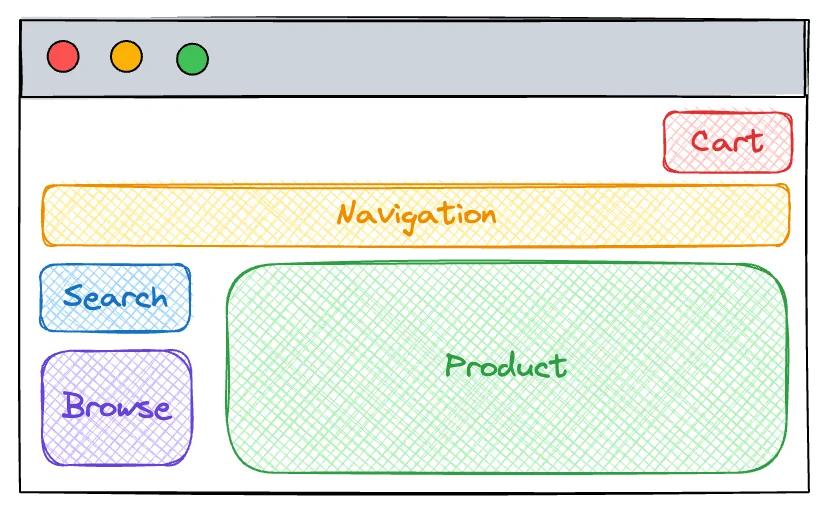
Imagine we have a web application made by different teams (each team is response for a part, e.g. the navigation, cart, search or product information), and there's an issue with the shopping cart we don't yet understand, based on customer feedback.
Our goal is to figure out exactly what's wrong, starting from not knowing much about the problem. This section shows how CloudWatch is essential for tackling these kinds of challenges, helping us keep our systems running smoothly.
Bad dependencies
The section on bad dependencies dives into why it's crucial to keep tabs on error rates across the whole server and individual webpages. It explains how using dimensions along with CloudWatch Composite Alarms can make a big difference in quickly spotting and dealing with problems. This part of the chapter stresses how detailed monitoring is key to finding and fixing bad dependencies.
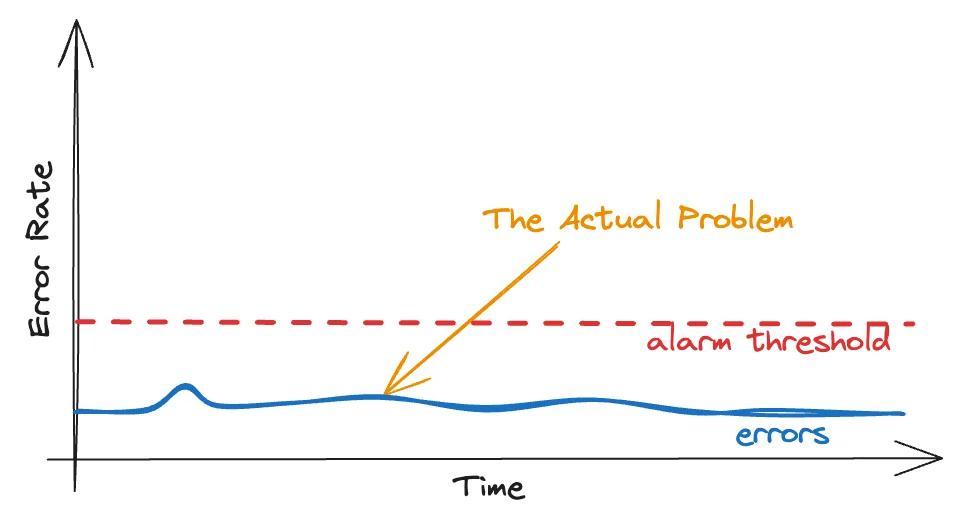
First step: Look at the server-wide error rate.
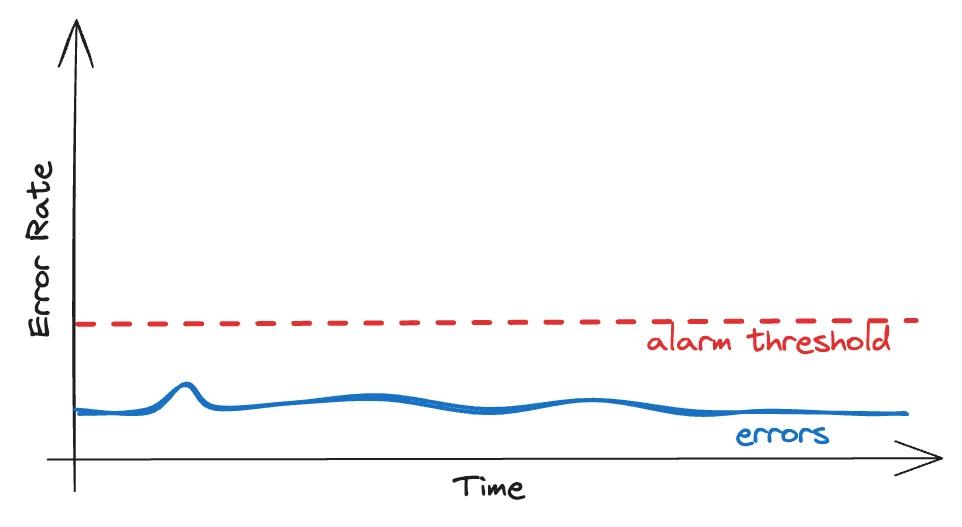
But here, we don't see any red flags since there's no spike in errors. Everything looks like it's running smoothly as usual.
But we definitely know that there is a problem, we just can't see it in our first view.
The game-changer: Dimensionality.
Right now, we're only watching the error rate for the entire site. A smarter move is to track errors for each webpage individually.
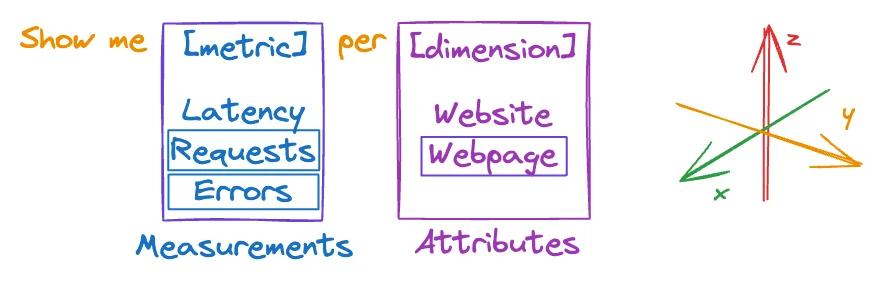
When we break it down by page, the picture becomes clear:
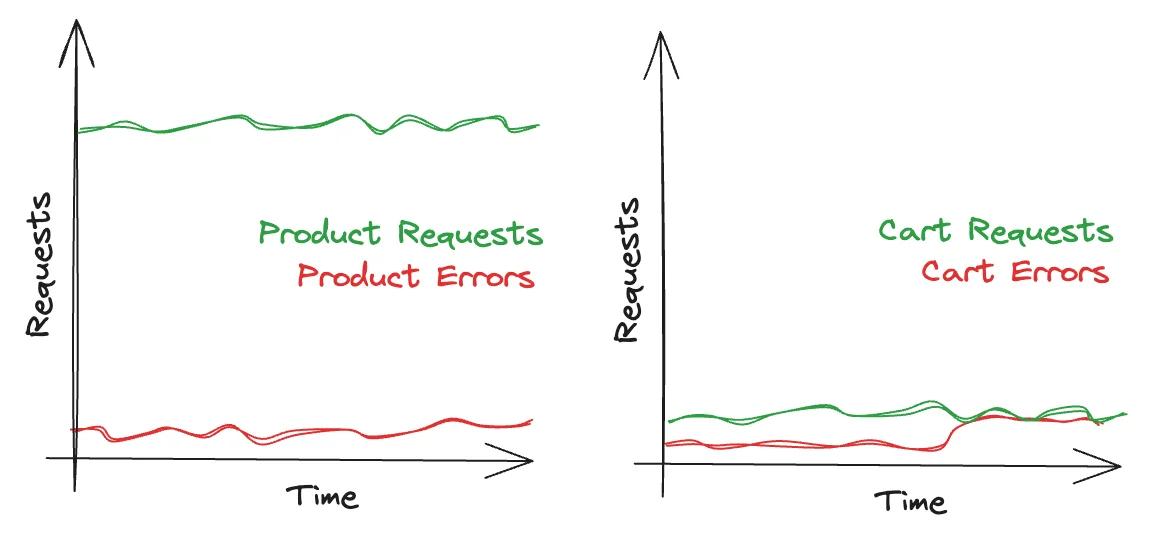
The shopping cart's error rate is way higher than other pages. But we couldn't spot this before because the product page gets a lot more traffic. The small uptick in errors for the shopping cart was masked by the volume of requests for the product page.
Setting up an alarm for each page lets us track errors more closely.
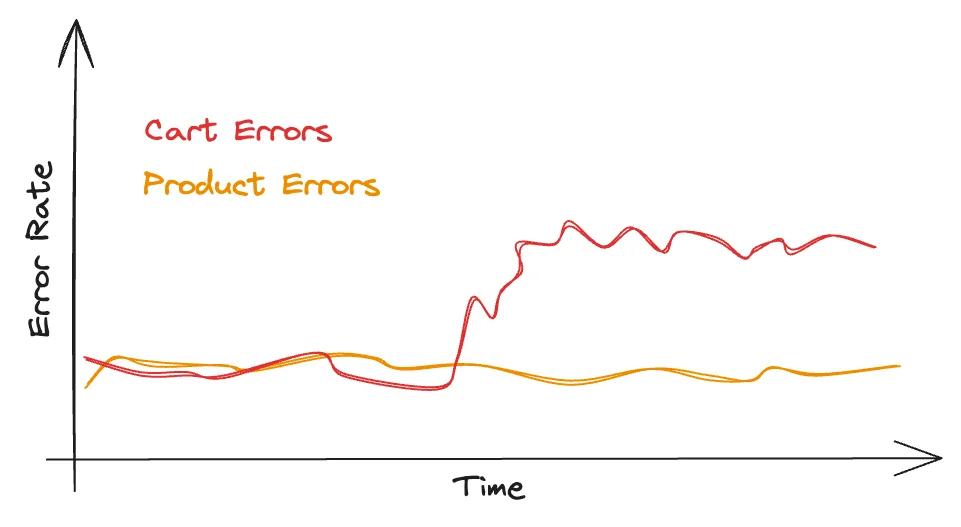
This approach helps us pinpoint problems much quicker.
But what if a common error hits every page?
This would create a lot of noise, as all of our alarms would trigger, even we're facing a common problem that is shared across all pages.
That's where bundling our separate alarms into one comes in.
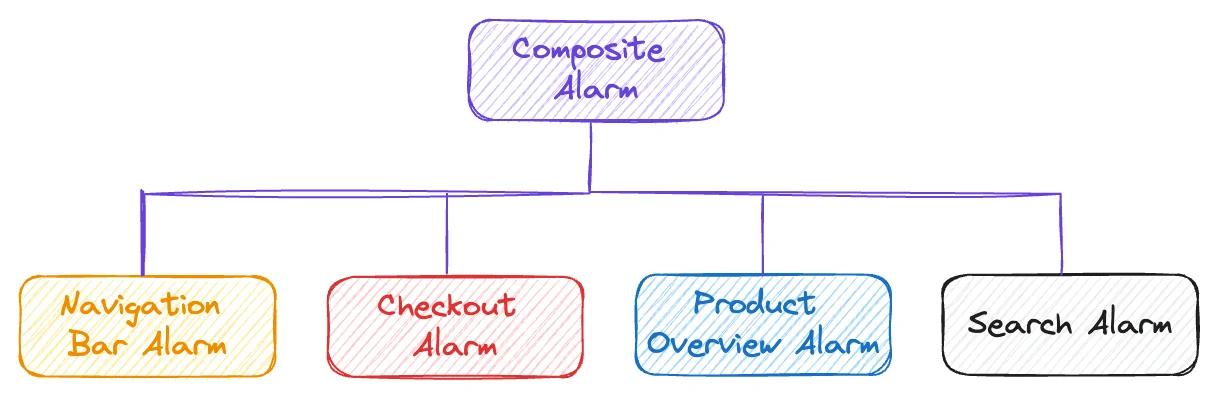
By using composite alarms, we can set a threshold that, when crossed for all pages, will trigger a single notification. This is crucial when managing numerous alarms to avoid being overwhelmed by alerts. This way we don't drown in the noise of alarms.
Key takeaways for tackling bad dependencies:
- Break down key application health metrics by customer use cases, like tracking errors per webpage or widget.
- Use CloudWatch Composite Alarms to bundle multiple alarm signals, reducing the risk of alarm fatigue.
Bad components
This section looks into the tricky world of distributed systems, highlighting how crucial it is to keep track of where data and requests go. It shows why we need to pass along trace context to get service maps to figure out where the failures actually happen. This is key for getting to the bottom of issues with bad components in our system.
We've narrowed down our issue to the shopping cart, but it's not clear if the problem is with the frontend, backend, or something else down the line. Given how interconnected everything is, pinpointing the exact source of trouble is challenging.
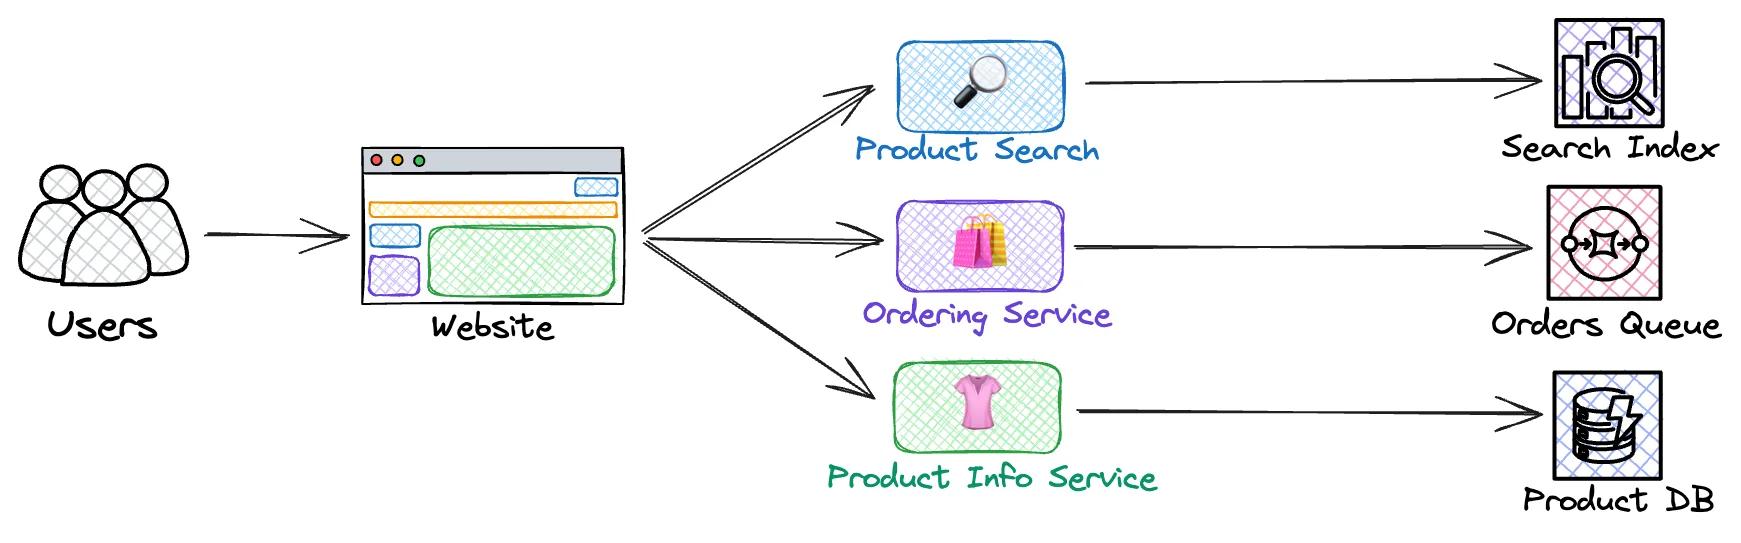
Here's the overview about our architecture that we use to run our application.
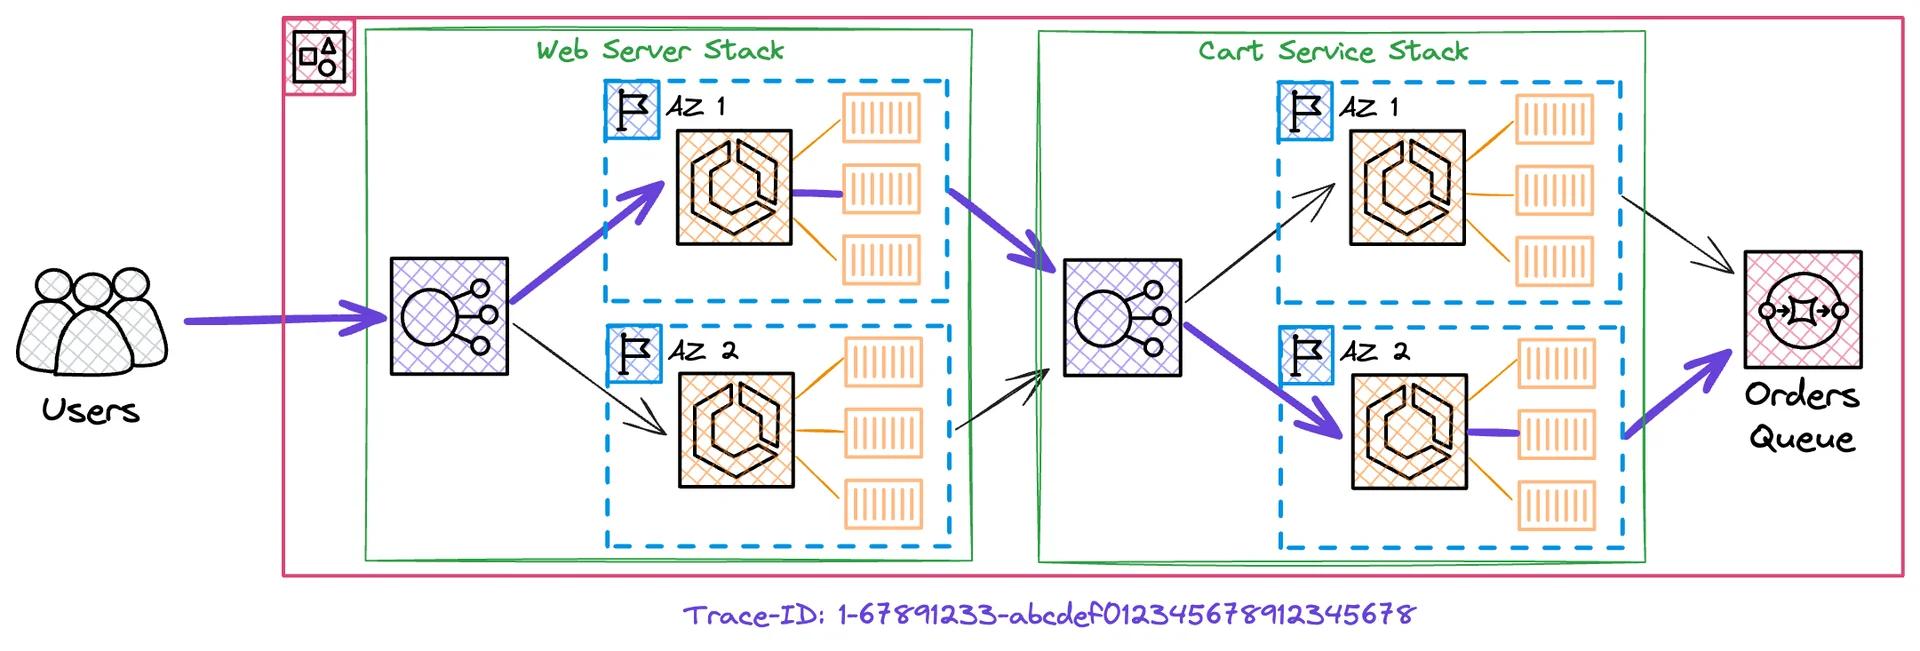
The journey begins with the first component creating a trace-id that's passed along through the entire system. This id helps us track the whole request path and see where things go awry.
All this data feeds into X-Ray, AWS's distributed tracing system, allowing us to see a service map (that is automatically generated) of our website's architecture.
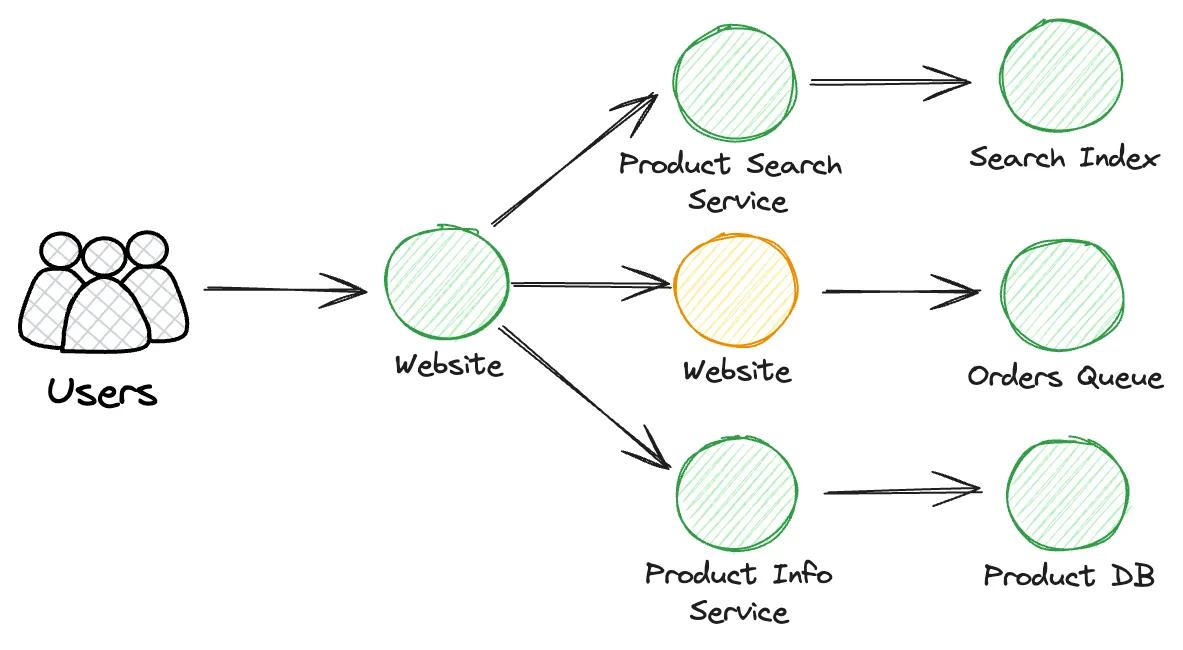
To spot a bad component, remember to:
- Forward the incoming trace context with every call to dependencies.
- Collect traces from all parts of your system, including AWS services and your apps, with X-Ray.
- Use service maps from these traces to find which part of your system isn't working right when problems pop up.
Let's look at a specific issue:
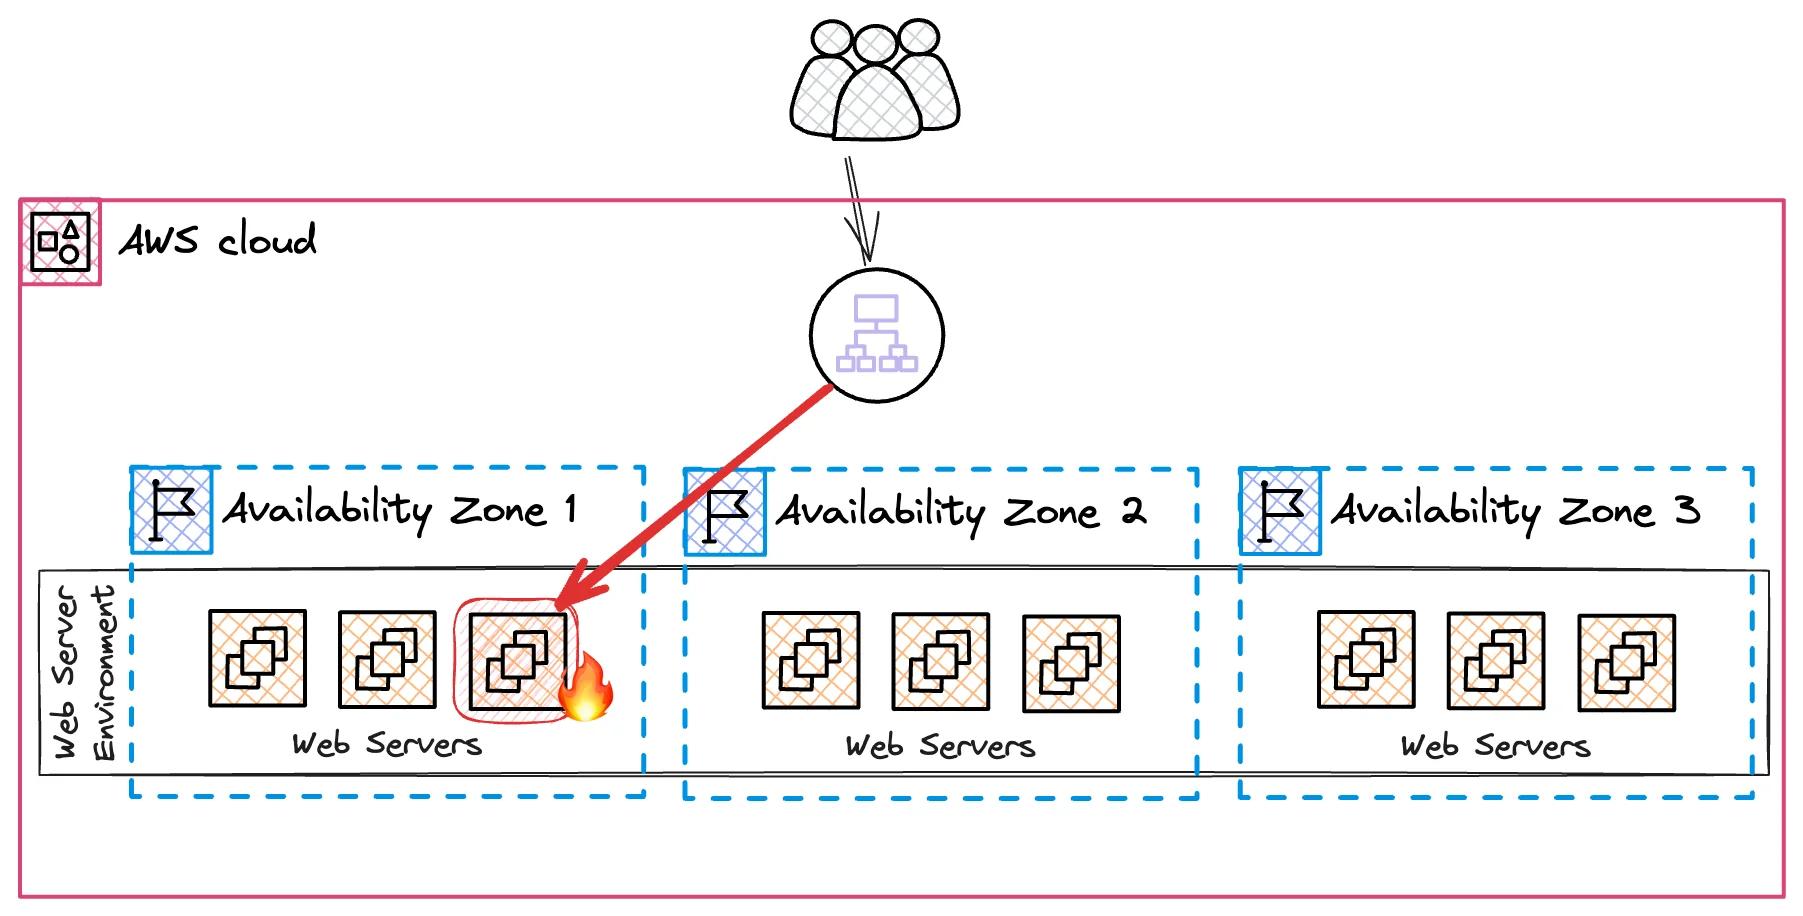
A server runs out of memory and crashes, hiking up our site's overall error rate. Thanks to health checks, we know which server's failing. The load balancer pulls it out of rotation, and error rates drop.
That's a very simple case where a load balancer's health check alone can detect and fix the issue.
But what if a server can't connect to a downstream component because of a bug or network issue? Health checks might still say it's fine, even though it isn't. We don't include this in health checks because it's a complex area and we can't (and mostly shouldn't) include the health of downstream components in our components.
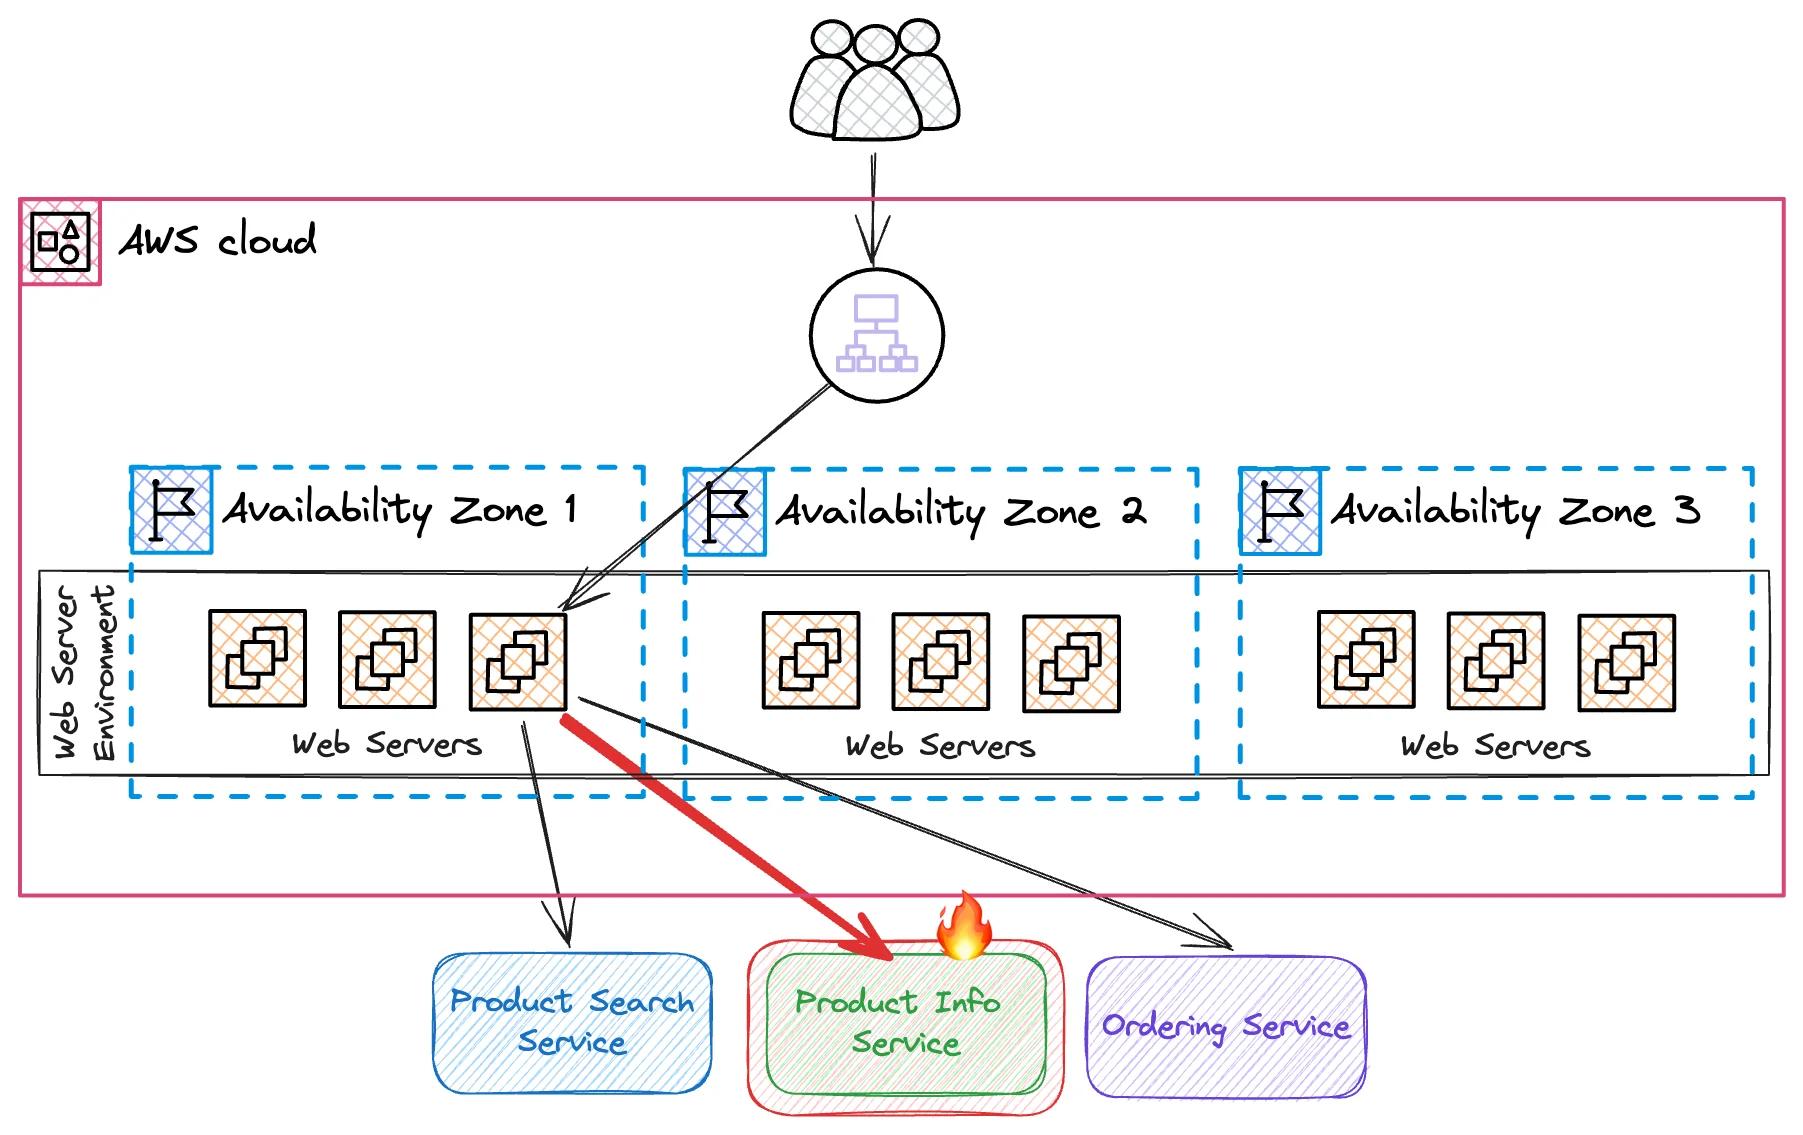
Now, our site's error rates are up, but the source isn't clear. All health checks of our instances are green.
The fix? You've guessed it. More dimensionality.
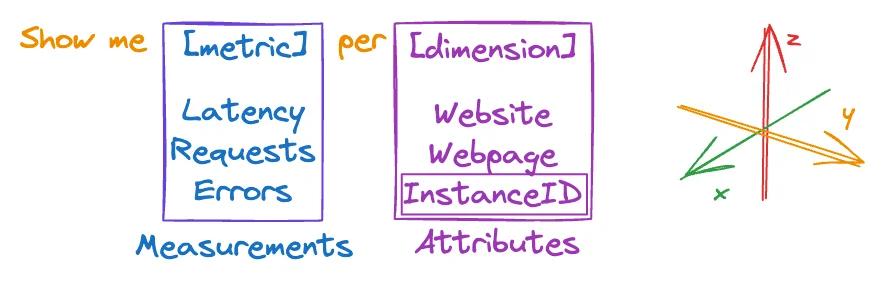
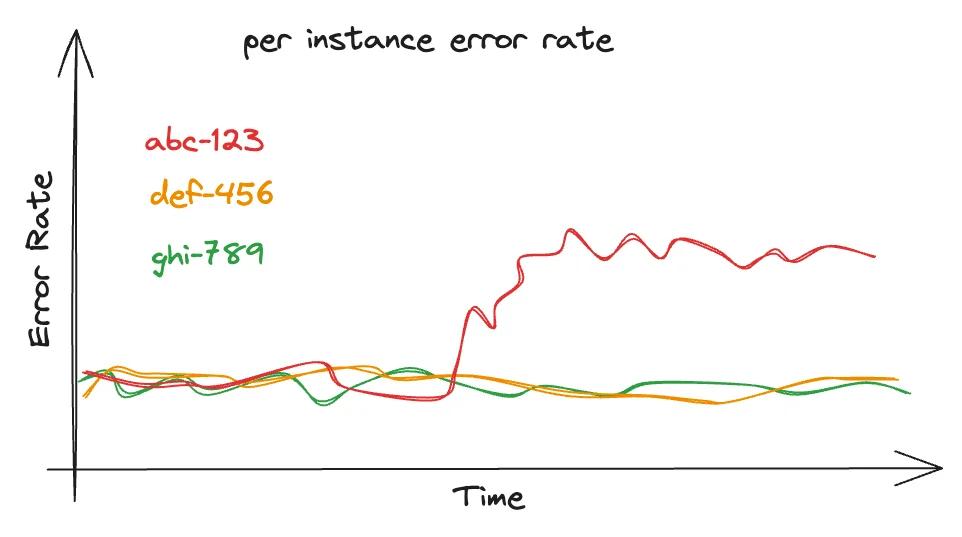
Let's look at errors by instance.
Setting up individual alarms for each new instance isn't practical with autoscaling. Instead, we use CloudWatch Metrics Insights queries and alarms to monitor:
q1 =
SELECT
    SUM(Failure)
FROM
    SCHEMA (MyWebsite, InstanceId)
GROUP BY
    InstanceId
ORDER BY
    SUM() DESC
LIMIT
    10 FIRST (q1) > 0.01 PERIOD = 1 minute DATAPOINTS = 2
We'll retrieve the top 10 instances with the most failures. Afterward, we'll filter only for instances that do have an error rate above 1%.
And now, with query builder, you can also use natural language to build your queries (right now, this is not supported in all regions).
But what about widespread issues, like a cache node failure in a specific availability zone? This could cause alerts for many servers in the zone, making it hard to find the root cause.
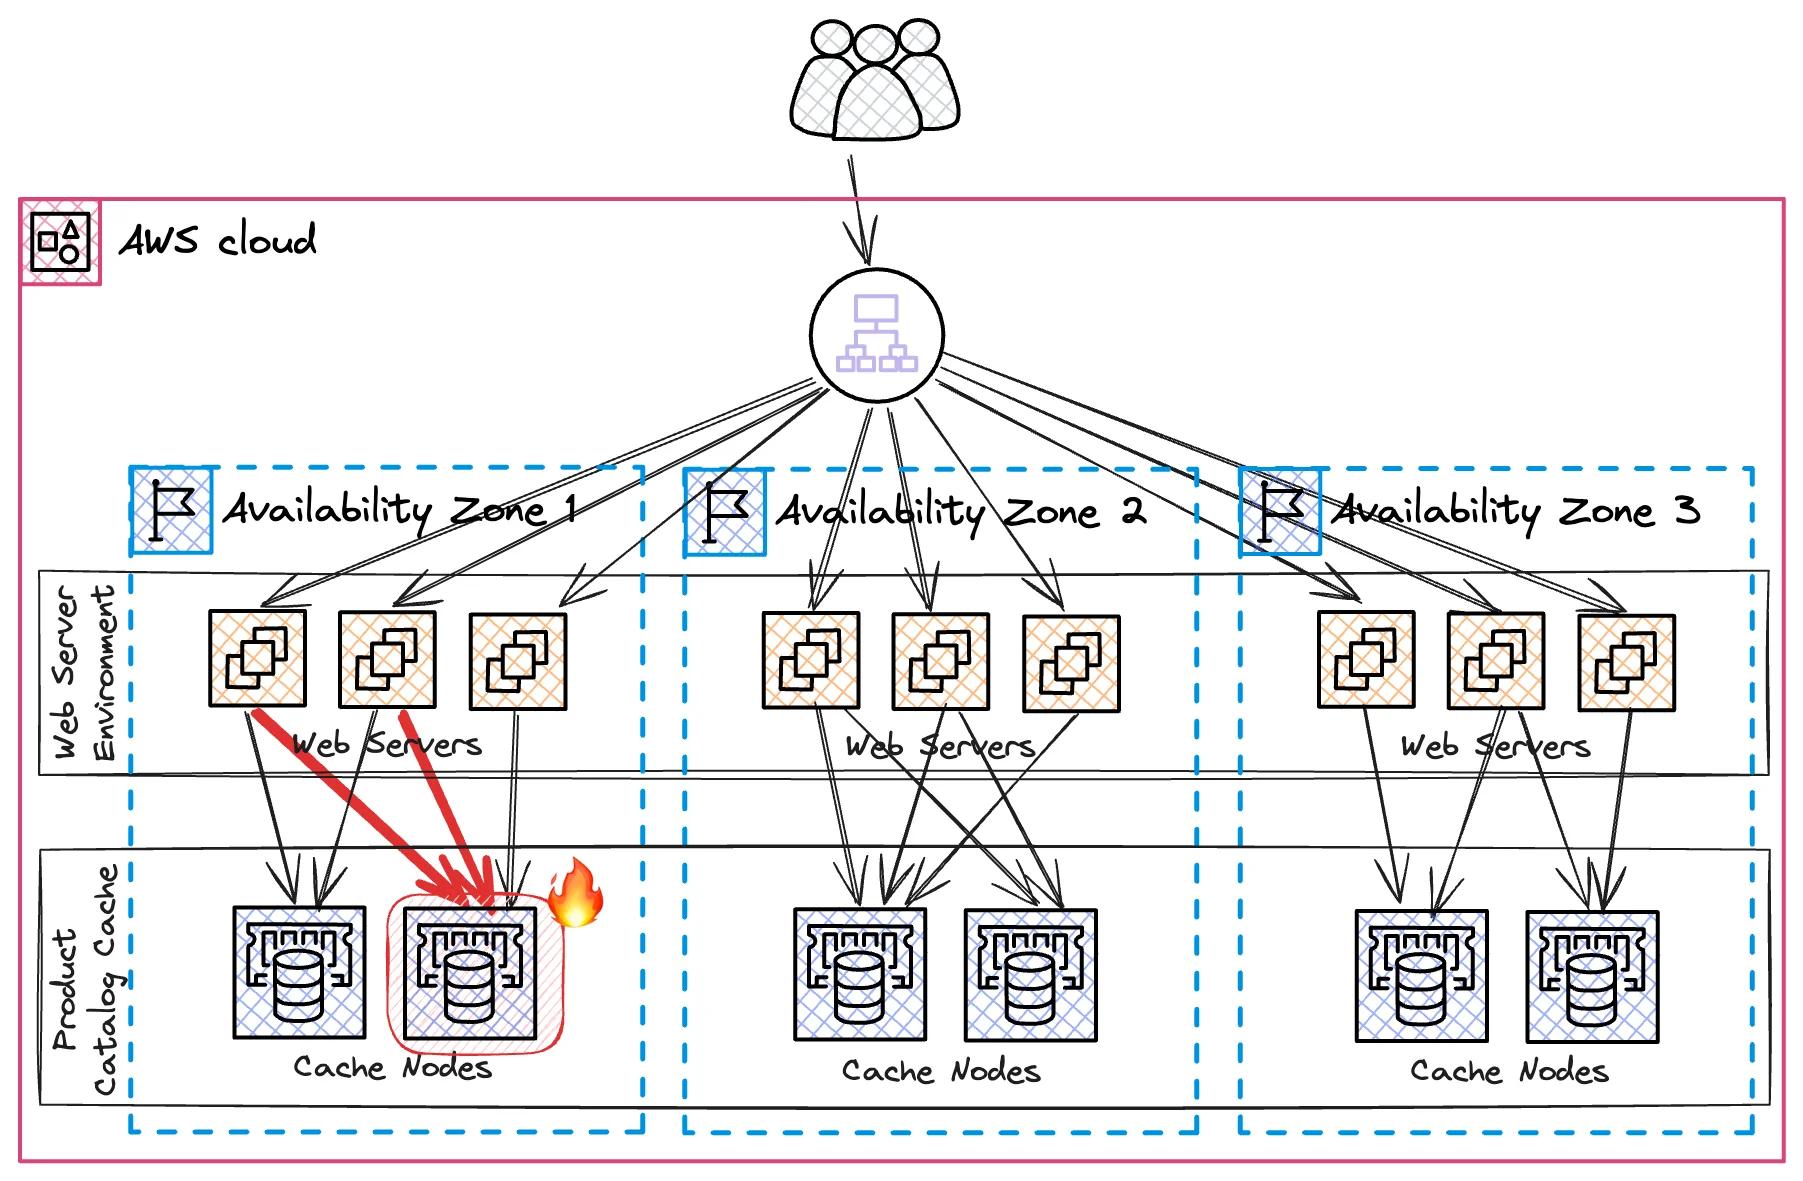
We add more detail to our metrics, like availability zones, to get clearer insights.
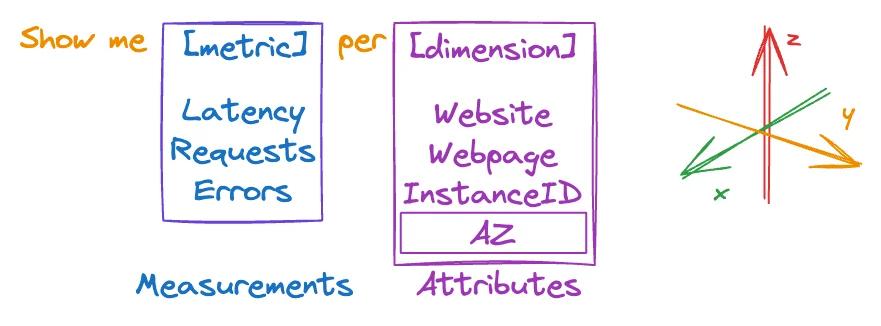
Now we can easily detect that the issue is within a single availability zone.
Key points for dealing with bad components:
- Break down health metrics by infrastructure boundaries, such as EC2 instances or availability zones.
- Use Metrics Insights queries to alarm on the parts of your infrastructure that are underperforming.
Bad deployments
This section talks about the mess deployment issues can create and how to clean them up fast. It pushes for using automatic rollback mechanisms to bounce back quickly from botched deployments. It suggests keeping an eye on specific health metrics tied to DeploymentId or CodeRevision. Plus, it points out how composite alarms can speed up dealing with deployment problems.
The main mantra: Roll back first, ask questions later.
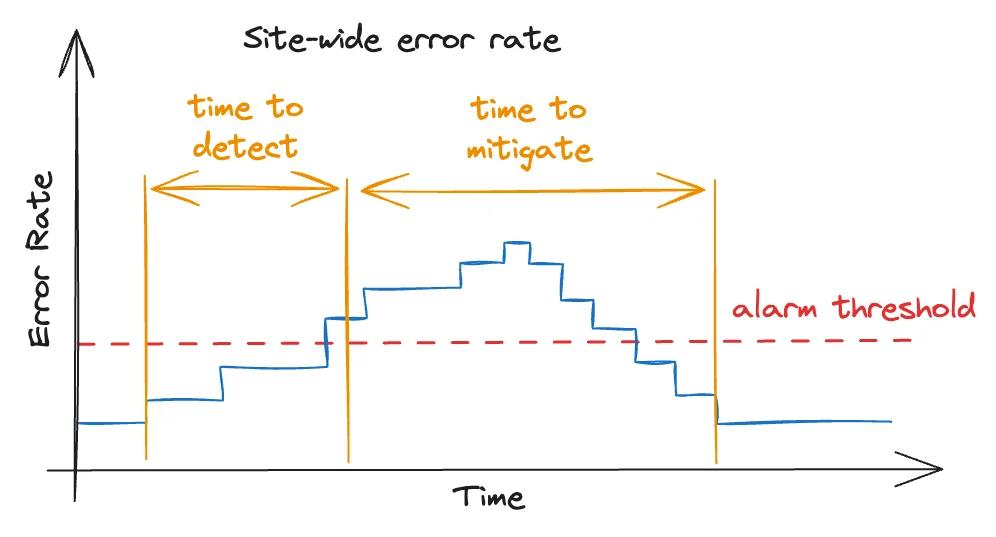
If we try to fix things by hand, it's a slow process:
- First, we need to realize that there's an issue.
- Then, we need to figure out that the deployment is to blame.
- Finally, roll need to roll back everything.
So, to summarize, the time from when the error rate spikes to when everything is fully rolled back can be quite long.
What can we do to improve?
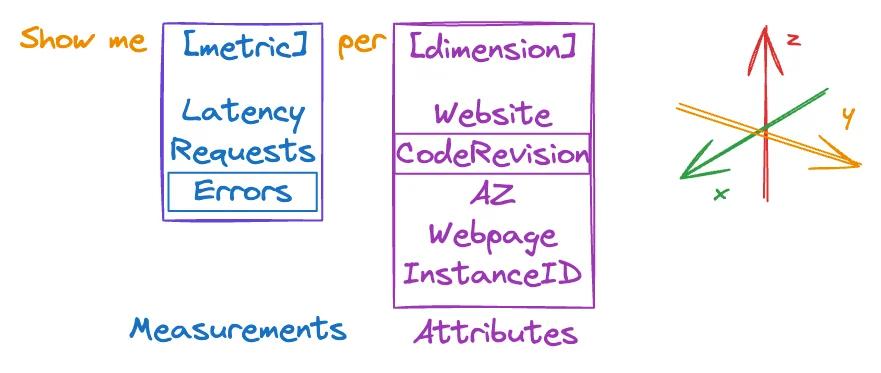
Here's where dimensionality comes into play again, this time with code revisions. This helps us see clearly that the new code revision is the troublemaker.
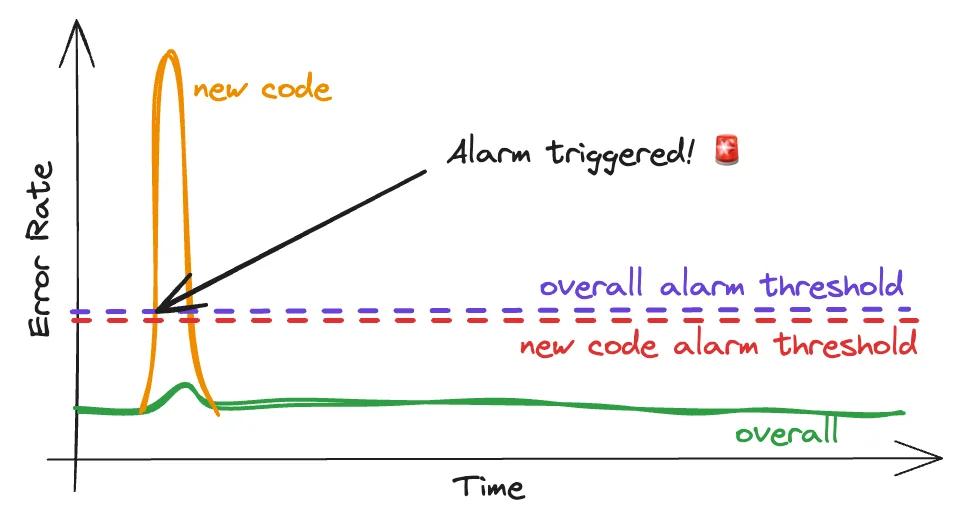
Now, we can quickly identify problems with the deployment and roll back swiftly, saving a lot of time. CloudFormation enables us to do exactly that—automatically reverse changes based on a single alarm.
Essential tips for tackling bad deployments:
- Break down crucial app health metrics by logical markers like DeploymentId or CodeRevision. This cuts down the time it takes to spot problematic updates.
- Always roll back changes automatically to reduce the time needed to fix things.
- Wrap up all your alarms into one big CloudWatch composite alarm to trigger rollbacks faster.
Traffic Spike
Handling traffic spikes involves getting into the nitty-gritty of dimensionality and structured logging. This method ensures detailed logging and analysis of complex metrics, with CloudWatch Logs Insights playing a key role in digging deep into the data.
It might all start with a Latency alarm that suddenly goes off.
So, what's behind this surge in traffic?
The answer lies in exploring dimensionality to uncover the source.
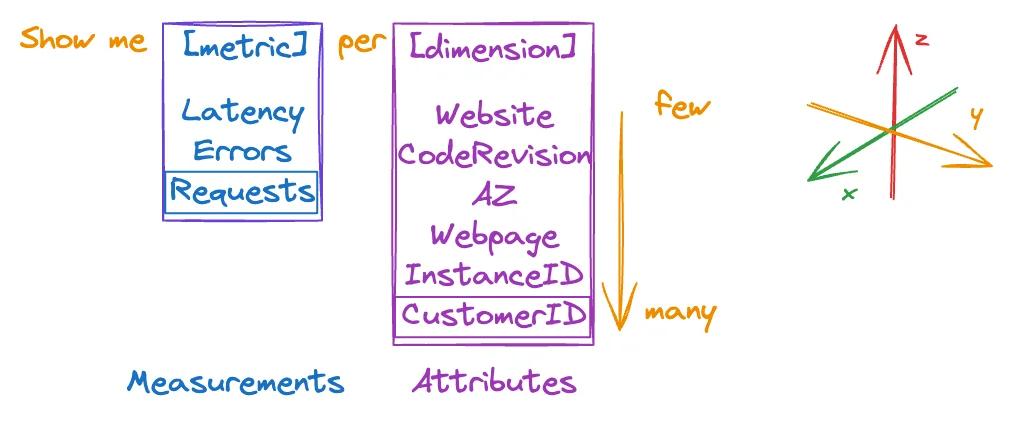
It's important to note that the more we drill down, the higher the cardinality per dimensionality becomes. This means:
- We have just a handful of websites.
- There are many availability zones.
- The number of instances spikes up significantly.
- And we have a vast number of customers, making it even trickier to visualize and understand.
Let's look at an example how a 'per-customer requests' chart could look like:
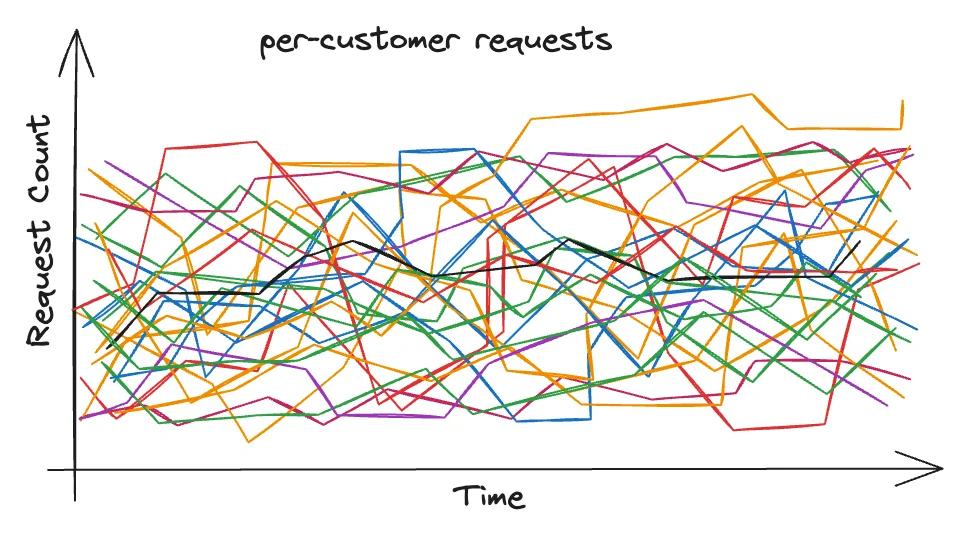
It's a huge mess that we can't make sense of.
What we're really after is identifying the top customers responsible for the traffic spike.
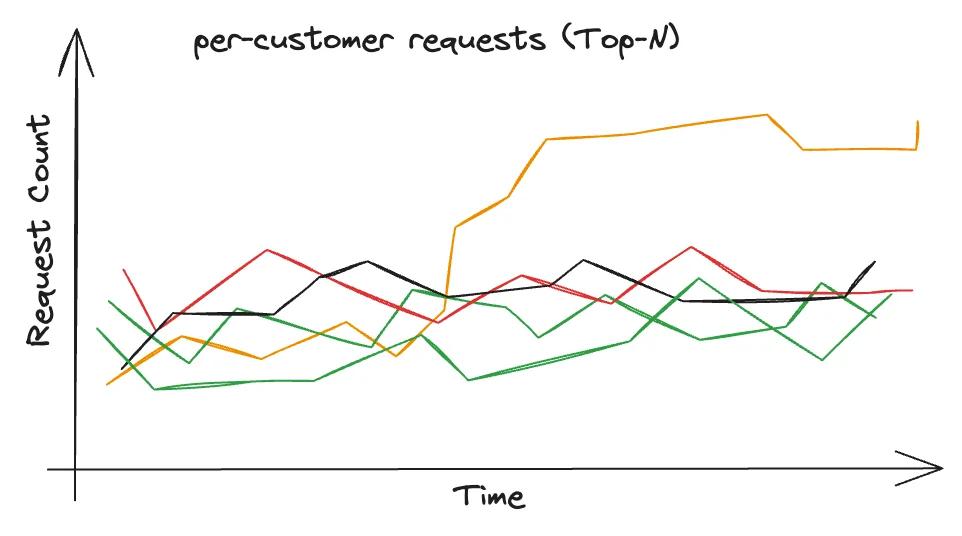
Next up, let's talk about structured logging.
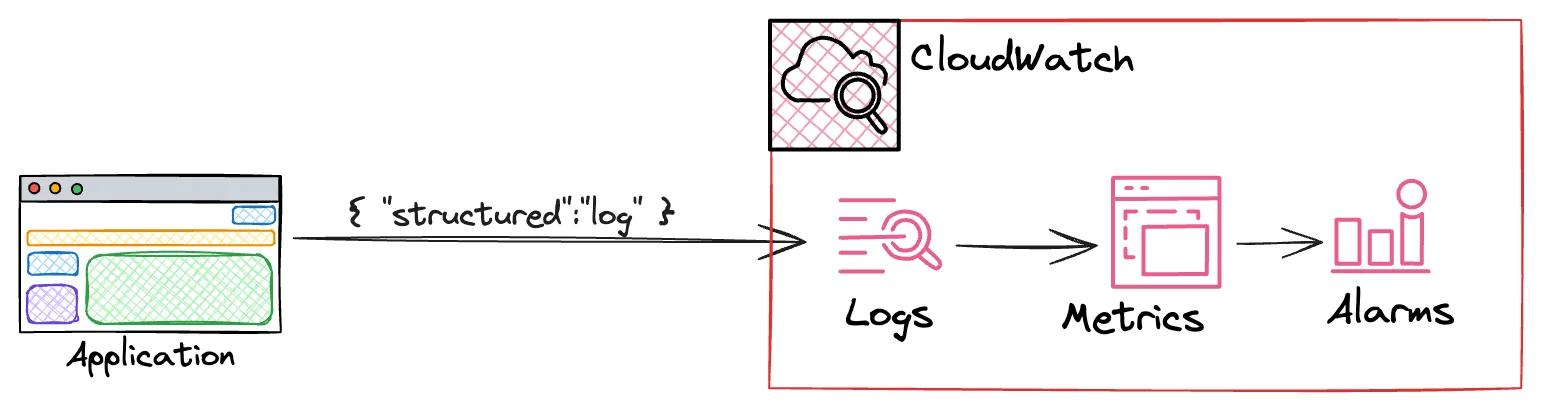
The application keeps track of its activities and logs them in CloudWatch Logs.
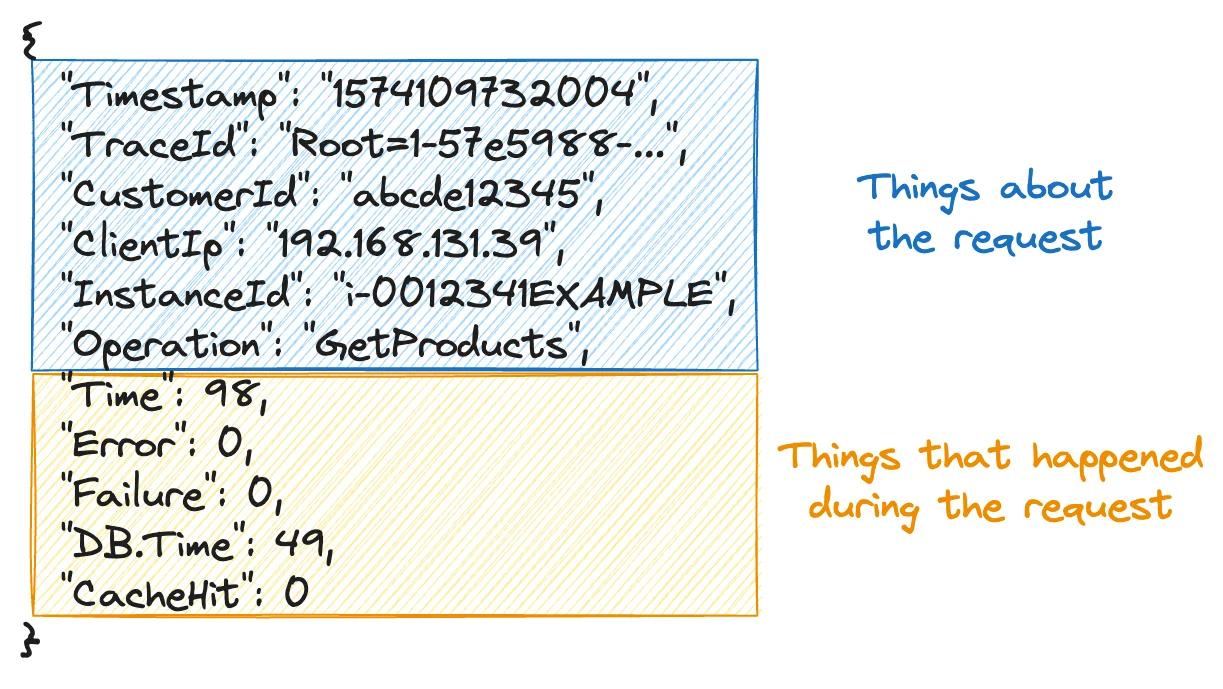
A key takeaway here is that applications will log their observations and actions in structured formats for every task or step. These logs are then sent to CloudWatch.
The strategy is to log everything first. Later, we can decide how to use these logs—whether to compute metrics, set up alarms, or something else. Essentially, "Log first, then decide how to slice, dice, and analyze."
One practical application is creating a Contributor Insights rule to count log entries per unique customer ID. CloudWatch then focuses on the top contributors, say the top 500 customers, which is invaluable for high cardinality metrics.
We can also perform on-demand analysis with CloudWatch Logs Insights:
filter clientIp = '192.168.123.456'
     | stats count(*) by bin(60)
This query filters logs to show only those with a specific client IP, then groups the results into 60-second intervals to count entries.
As long as we're logging all critical info, we can always revisit and calculate the metrics we need through CloudWatch Logs Insights. It's like being able to travel back in time to analyze data.
Crucial points for managing traffic spikes:
- Log extensively and richly to enable multidimensional metric analysis.
- Use Contributor Insights to track and analyze high cardinality metrics, such as customer request volumes.
- Leverage CloudWatch Logs Insights to dissect metrics you didn't initially set up, offering flexibility in how you analyze and understand your data.
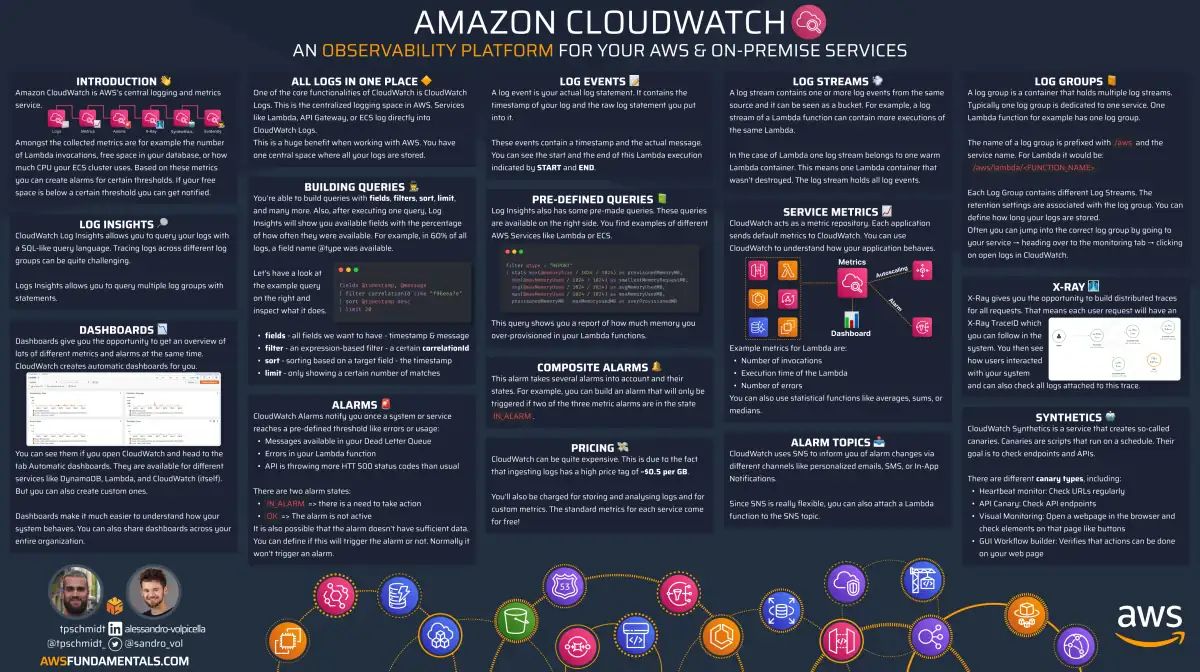
CloudWatch on One Page (No Fluff)
Monitor like a pro. Our CloudWatch cheat sheet covers metrics, alarms, and logs - everything you need for effective AWS monitoring.
HD quality, print-friendly. Stick it next to your desk.
Uncover hidden issues
To truly understand and troubleshoot the full spectrum of issues your application might face, it's essential to measure performance and errors from every possible angle, not just from within your own infrastructure. This includes keeping an eye on what happens outside your servers, where a lot can go wrong either before a request reaches your system or after a response has been sent.
Currently, our monitoring efforts are focused on our webservers and the components downstream.
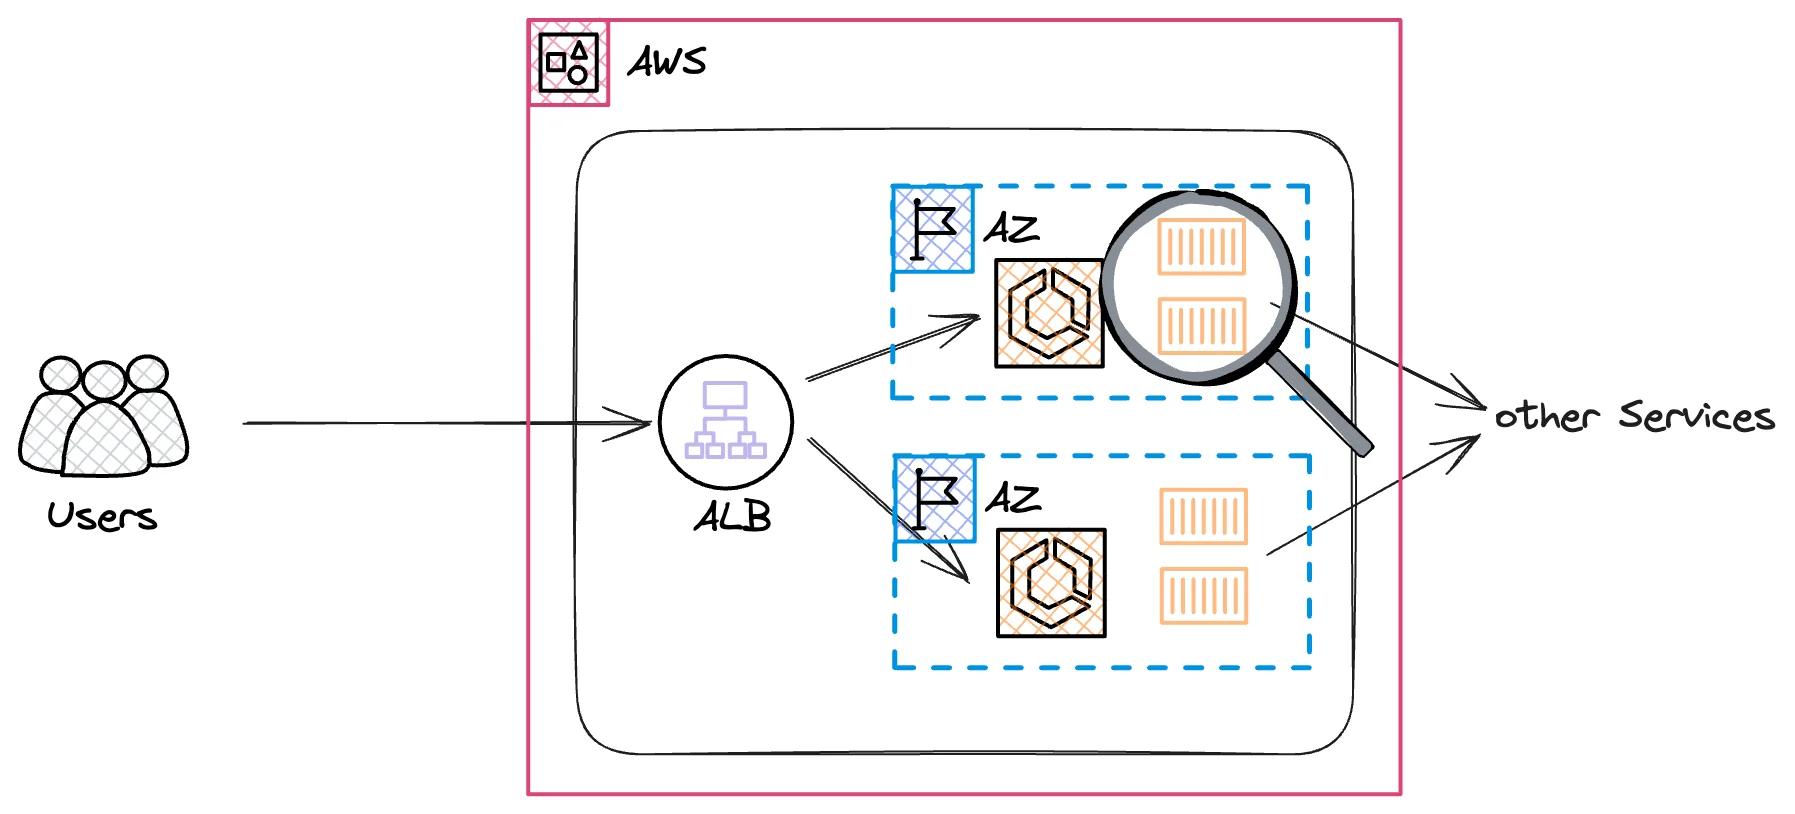
But what about the components that come before our APIs?
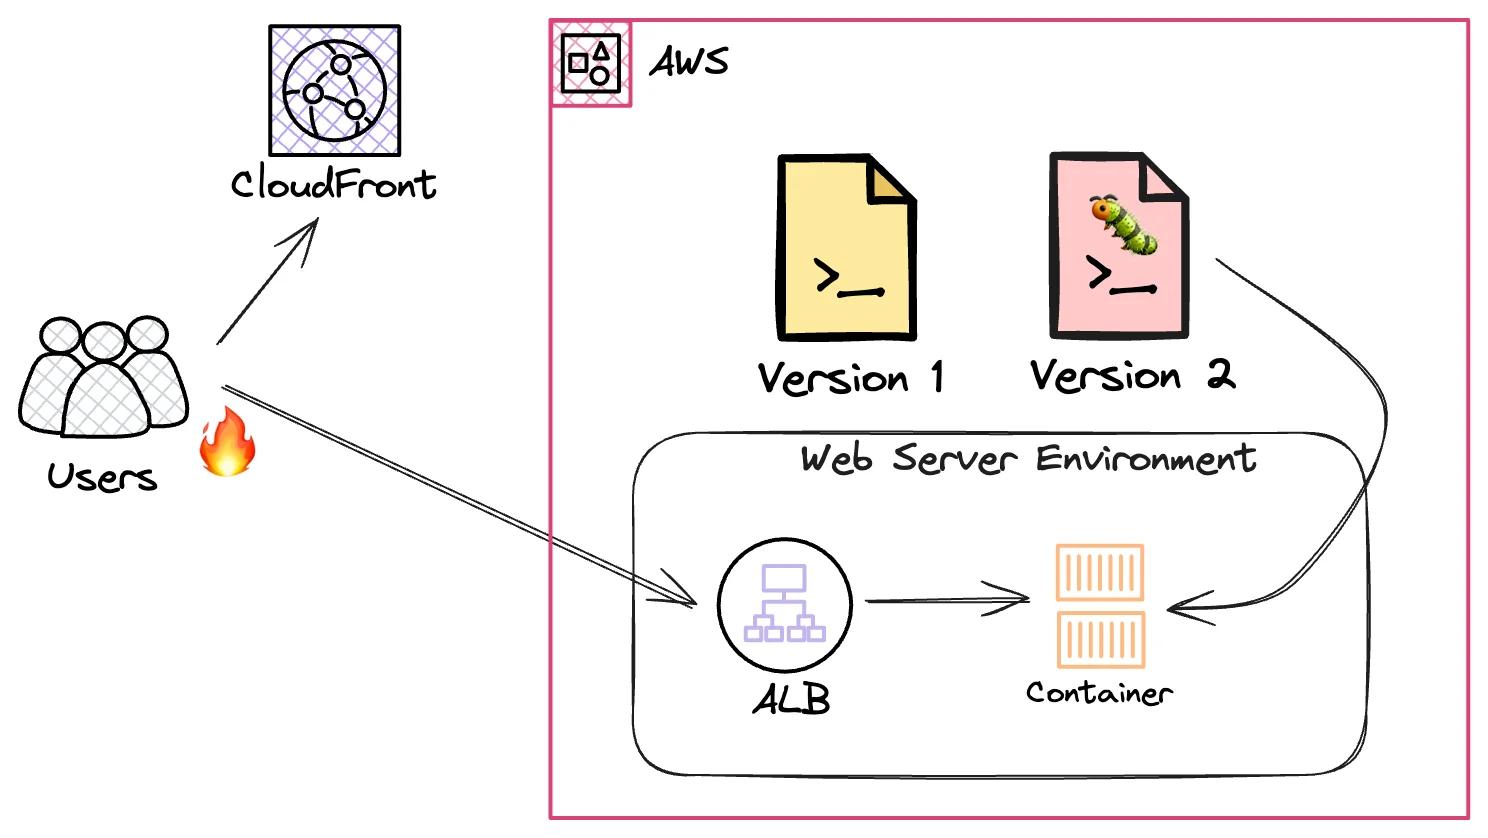
For instance, deploying new frontend code that's incompatible with the existing API (e.g. because we broke an API contract) could cause errors for users as they receive and try to interact with new static assets that don't play well with the current API version.
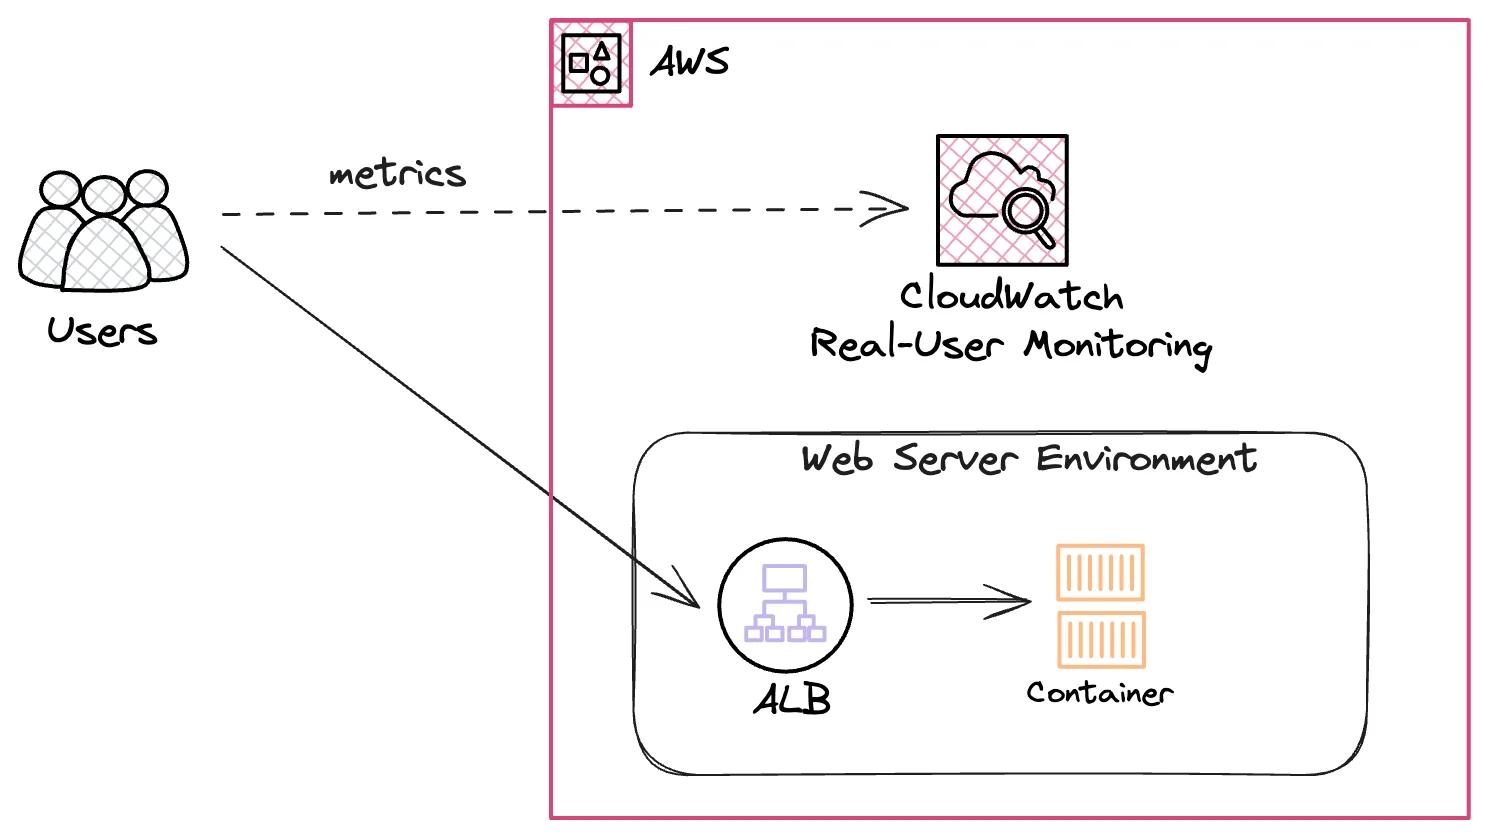
To get a direct line of sight into the user experience, we can measure directly from the user's browser. This real-user monitoring (RUM) provides invaluable insights into how changes in the backend or frontend impact the user directly.
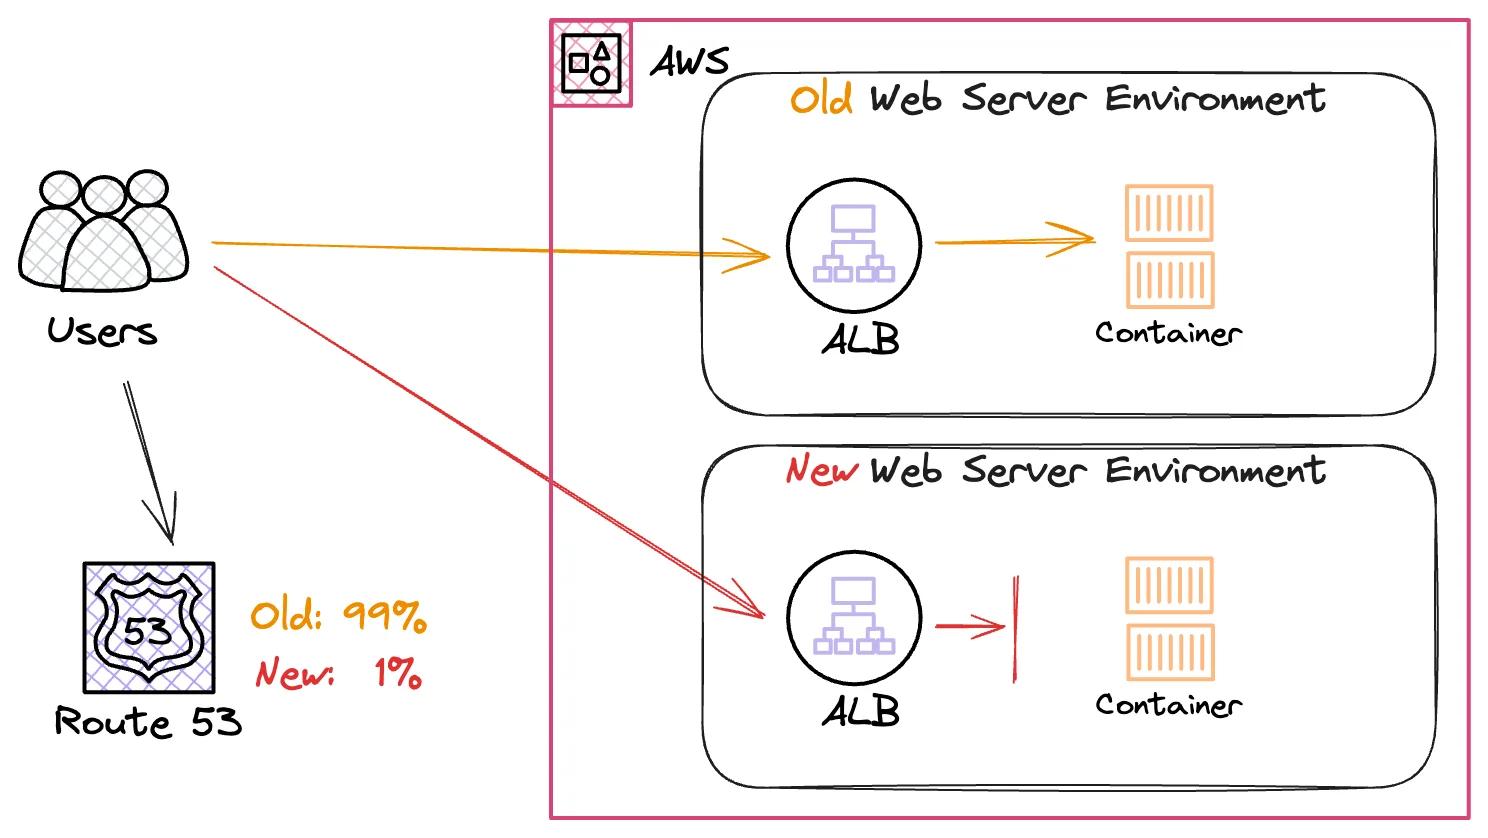
Consider a migration scenario where something goes wrong in the new environment. If we're routing traffic gradually via Route53, only a fraction of users will encounter errors, sending us a diluted signal of the underlying problem we might not even detect due to having alarm thresholds that are too high.
In such cases, relying solely on RUM might not give us the full picture.
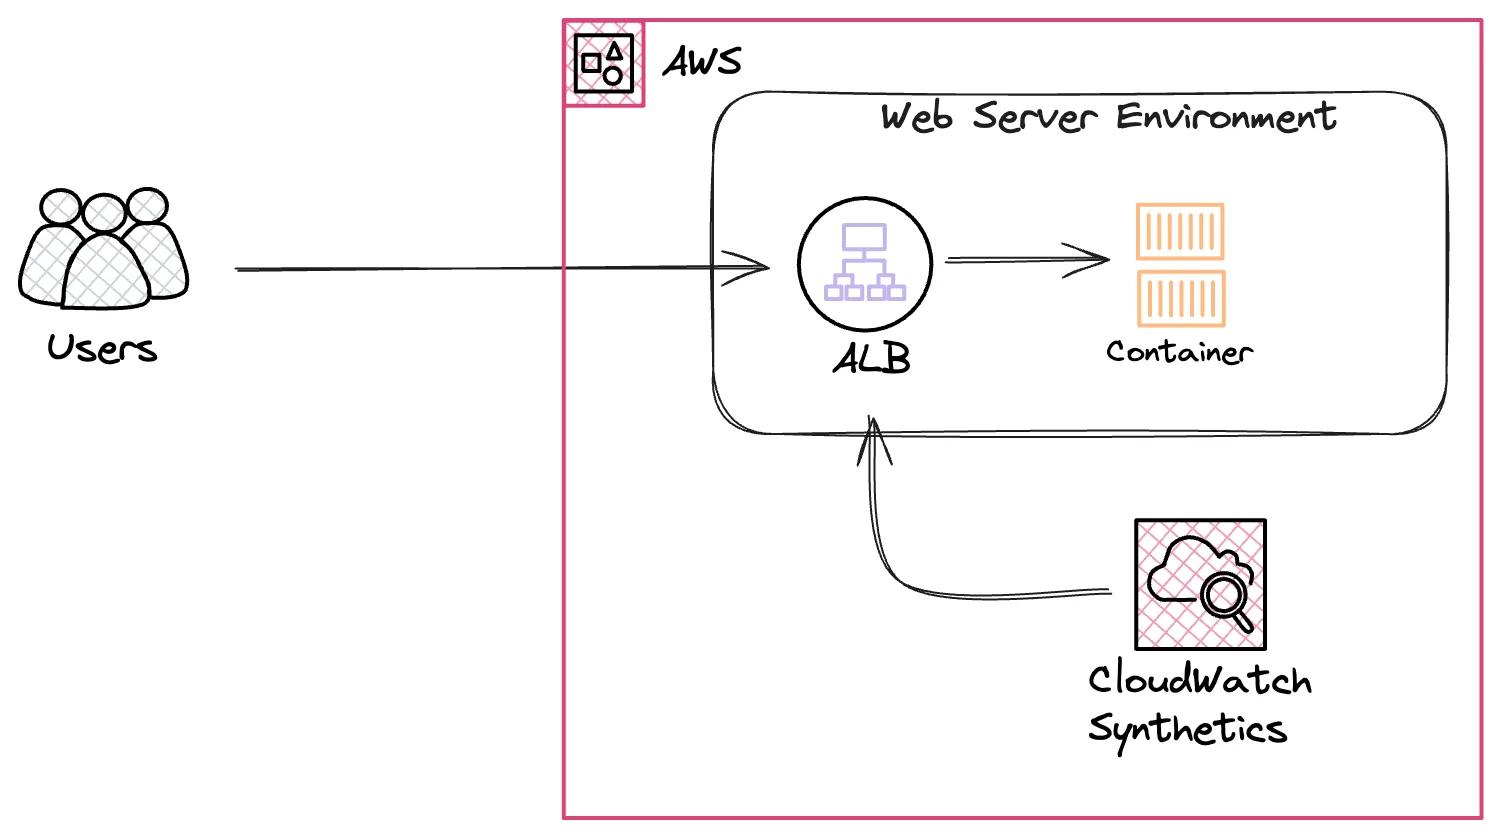
This is where Synthetic monitoring comes into play. By setting up synthetic tests to run continuously from various locations, we can simulate interactions with our application from all around the world, providing a constant stream of data on its performance and availability.
Summary for uncovering hidden external issues:
Employ both synthetic monitoring and real-user measurements to capture a comprehensive view of your application's health, ensuring you can identify and address issues that occur beyond the boundaries of your own servers.
Uncover hidden misattributed issues
When we change something like reducing the maximum length of an input field from 100 to 50 characters and then deploy that change, it might pass all our integration tests without any issues.
However, this introduces a different type of problem: client-side errors (HTTP 4xx) rather than server-side errors (HTTP 5xx). These errors occur because of a change we made, leading to client faults.
To catch such issues, dimensionality becomes our friend.
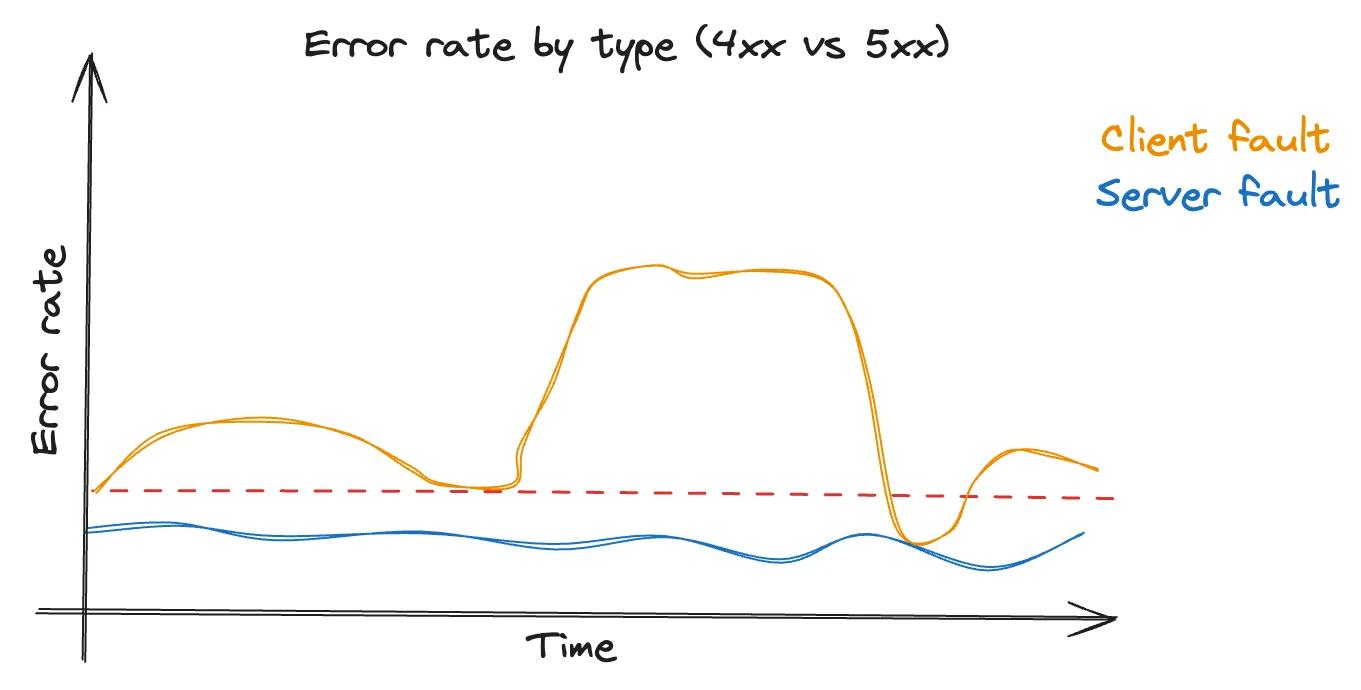
Setting a threshold for error detection can be tricky.
- Too low, and we're swamped with false alarms because of a few users' mistakes (as it still can be a client fault after all).
- Too high, and we risk overlooking the issue altogether.
Analyzing the error rate by client might give us something like this:
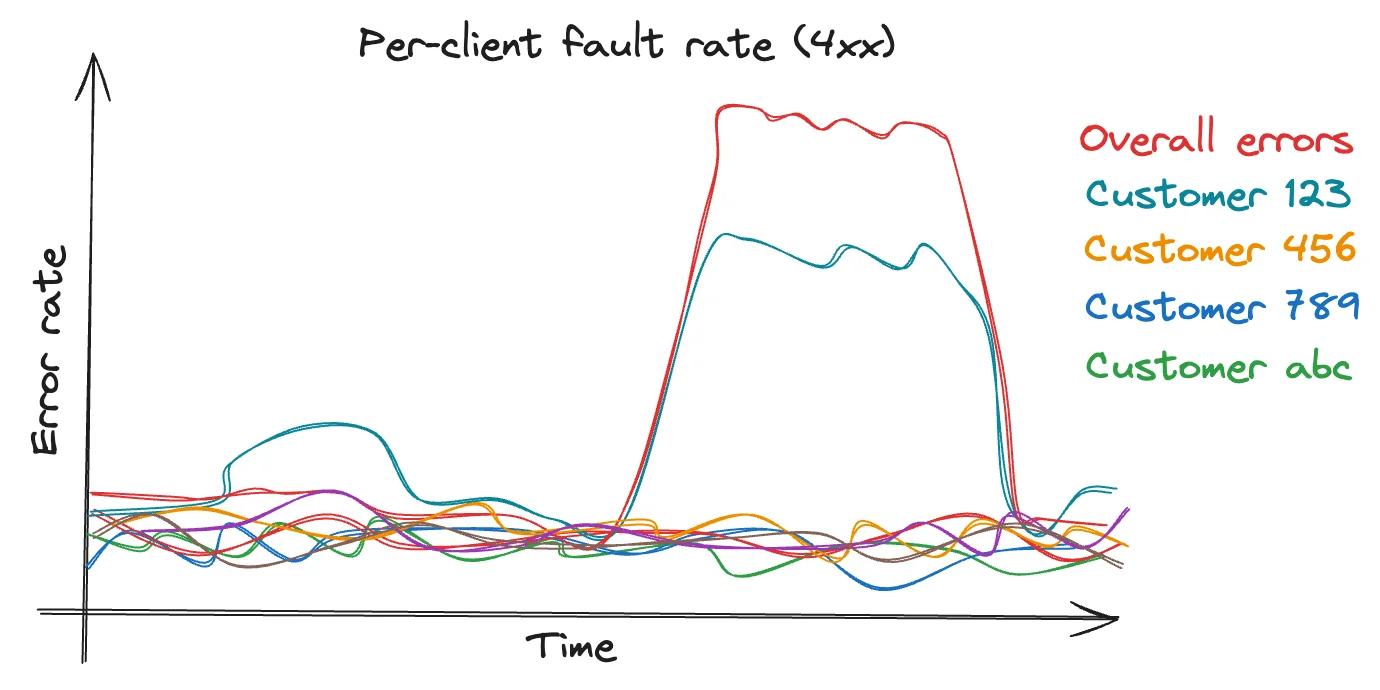
But this alone isn't very helpful. It doesn't tell us if the problem is widespread or if just a few customers are using our service incorrectly.
However, this graph is a clear indicator of a problem:
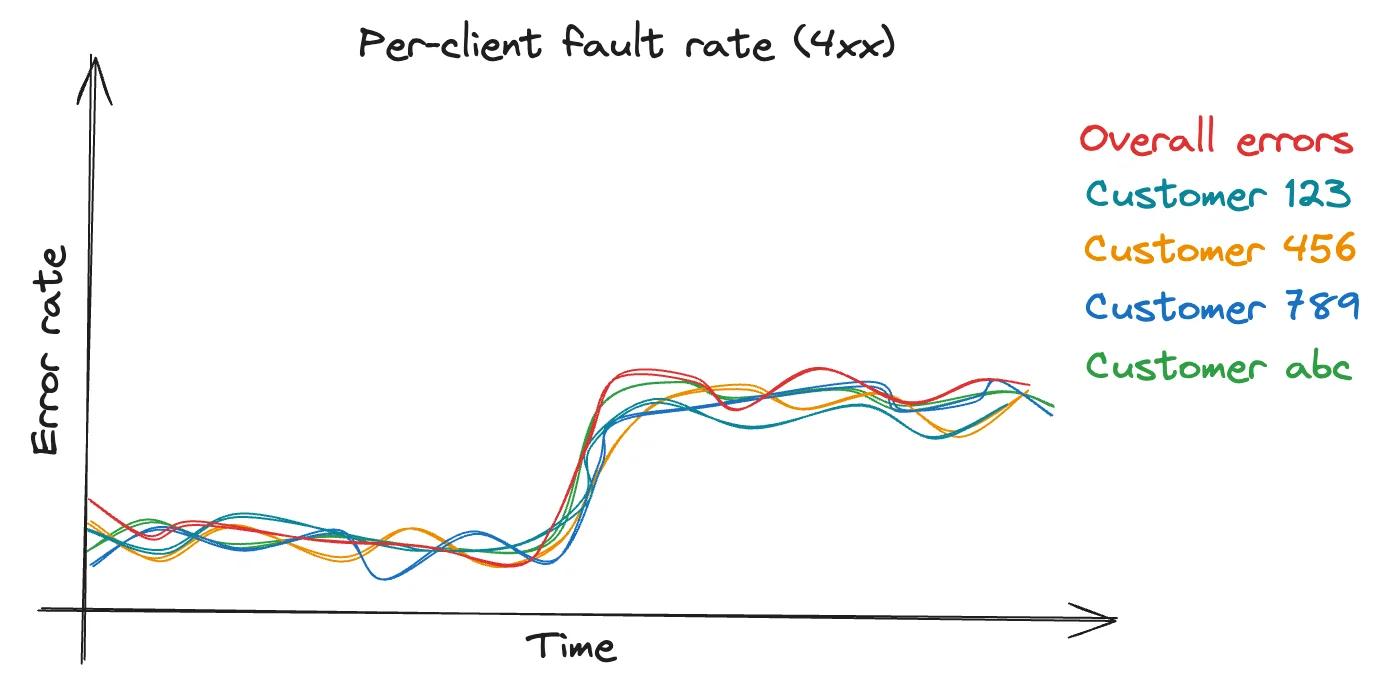
It's improbable that many top clients suddenly start making mistakes at the same time. This points to an issue on our end.
But how do we set an alarm for this pattern?
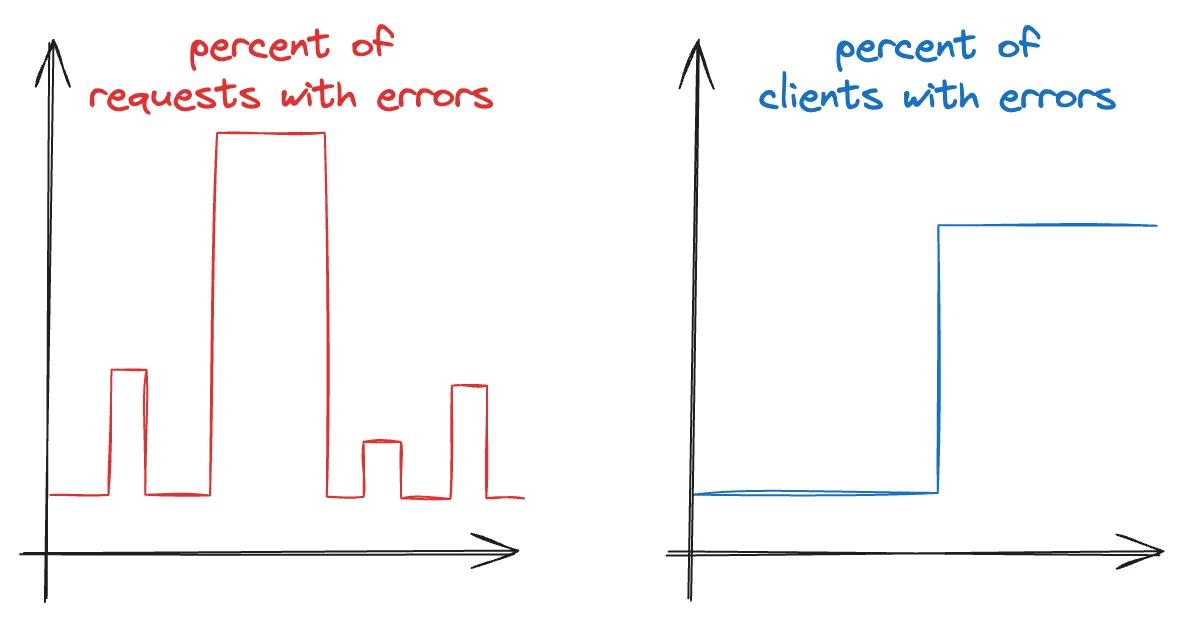
We're focusing on setting alarms not based on the percentage of requests with errors, but on the percentage of clients experiencing errors. A correlation here is a clear indicator that the errors originate from our end.
This is where CloudWatch contributor insights rules come into play.
By calculating the ratio of customers with errors to the total number of customers, we get a clear picture of the issue:
number of customers with errors
-------------------------------
number of customers
With this metric, it becomes apparent when a significant portion of our customers encounters increased errors, pointing towards a systemic issue rather than isolated client mistakes.
Key takeaways for identifying hidden issues caused by misattributions:
- A surge in client-side errors across many customers often indicates a problem with the service, not the clients.
- Use metrics like "percentage of affected customers" over "percentage of requests" by leveraging Contributor Insights Rules. This helps to understand the scope and impact of the issue more accurately.
Prevent future issues
To prevent future issues and ensure your system remains robust and responsive, it's crucial to adhere to resilient operational practices. This involves closely monitoring all aspects of your infrastructure's utilization and responding promptly to alarms and events. By adopting a comprehensive approach to monitoring, similar to treating game days with the same rigor as production environments, you can significantly enhance system reliability and performance.
Our architecture's foundational elements all share a common theme: elasticity.
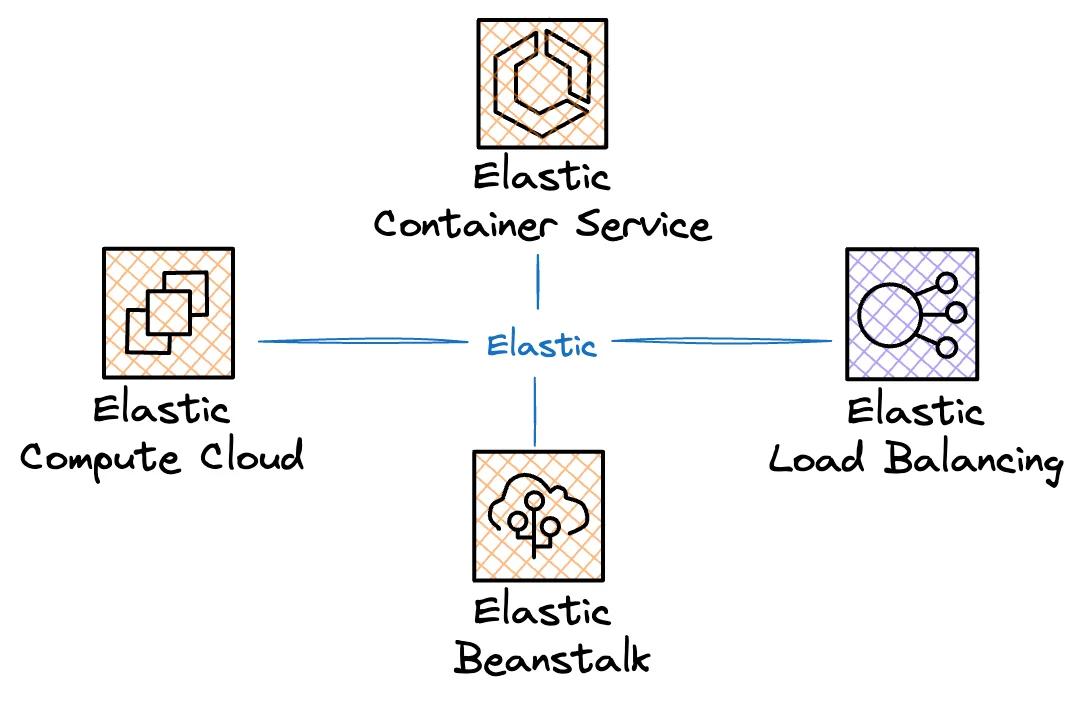
However, the "elastic" feature doesn't just work right out of the box without any effort on our part.
To operate your system resiliently, it's necessary to measure every possible utilization metric:
- CPU
- Memory
- File System
- Thread Pools
- Network
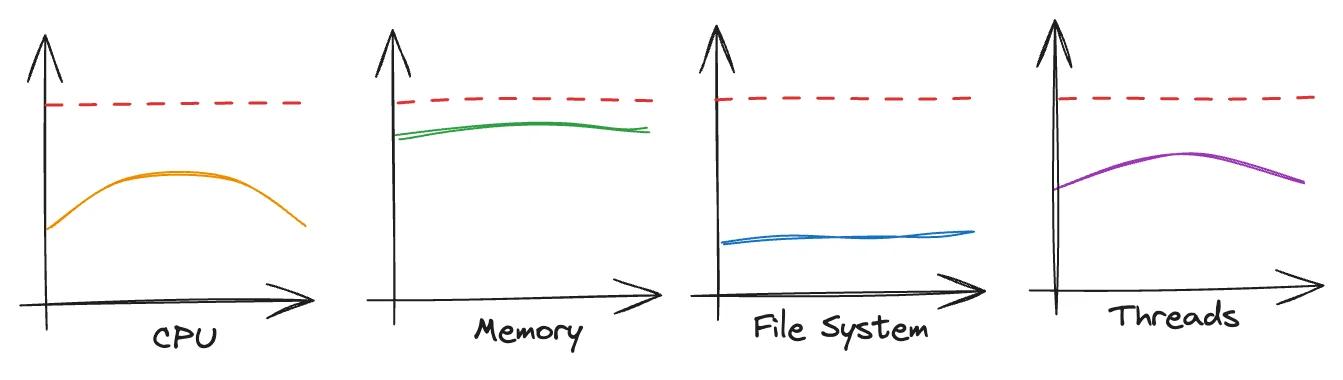
With the right metrics and thresholds in place, you can set up automatic alarms and scaling procedures to address changes proactively.
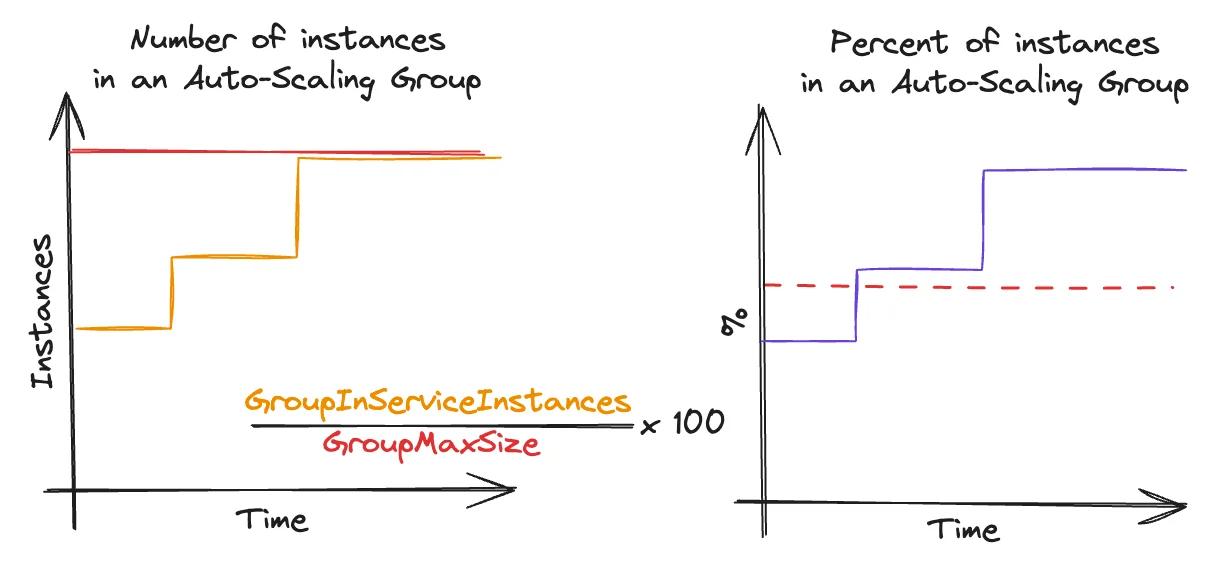
Employ metric math to derive meaningful metrics, such as calculating the average CPU utilization percentage across instances, ensuring you're monitoring the most relevant data for your needs.
AWS offers a suite of default metrics that are automatically calculated, simplifying the process of monitoring your resources.
Key strategies for averting future issues:
- Implement Auto Scaling across all elastic resources to quickly adapt to workload variations, ensuring your system has sufficient capacity to handle incoming requests without over-provisioning.
- Comprehensively measure utilization across all facets of your infrastructure—CPU, memory, file systems, thread pools, network, and quotas. Establish alarms and a capacity dashboard to keep a close eye on resource consumption, allowing for timely adjustments and maintaining system health.
Game Days
Good game days are essential for testing the resilience and reliability of your systems in a controlled and meaningful way. Here are the characteristics that make game days effective:
- Reasoned: Begin with a specific hypothesis about how your system will behave under certain conditions. If the outcome doesn't align with your expectations, it's crucial to investigate and understand why. This could involve a scenario where you encounter an unexpected issue and need to verify that the system's response matches your theoretical model.
- Realistic: Ensure your testing environment closely mirrors your production environment, or consider running tests directly in production for the most accurate insights. This approach guarantees that the findings from your game days are applicable and actionable in your live environment.
- Regular: Conduct these tests regularly, such as on a quarterly basis, and treat them with the seriousness they deserve. Consistency in testing helps identify and mitigate potential issues before they impact your customers.
- Controlled: When running experiments in production, it's vital to ensure that these tests do not negatively affect your customers. Have mechanisms in place to quickly halt the game day activities if things start to go awry.
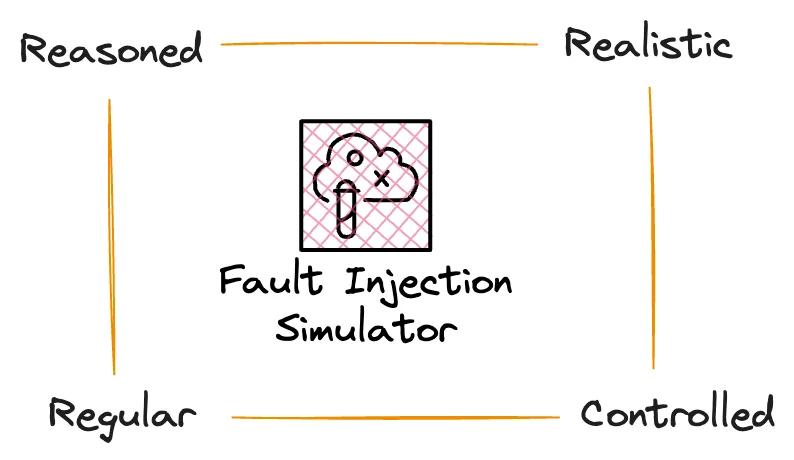
Observability plays a crucial role in game days:
- Replicate Production Observability: Ensure your test environments replicate the observability setup of your production environment. This includes metrics, alarms, dashboards, and logging capabilities to accurately monitor and respond to system behavior during tests.
- Verify and Adjust: Use game days to validate the behavior of your observability tools and make any necessary adjustments. This might involve adding new instrumentation, metrics, or alarms based on the insights gained.
- Observability as Code: Treat your observability setup with the same rigor as your infrastructure by defining it as code (Infrastructure-as-Code or in this scenario: Observability-as-Code). This approach ensures consistency and reliability across environments, allowing you to deploy the same monitoring tools and configurations in both test and production settings seamlessly.
Key takeaways for game days:
- Regularly simulate failure scenarios using tools like the AWS Fault Injection Service to explore and understand different failure modes in a safe, controlled environment.
- Maintain parity between test and production observability tools by incorporating alarm and dashboard definitions into your infrastructure as code. This ensures that your team is equipped with the necessary insights to act quickly and effectively, both during tests and in real-world scenarios.
Related Reads
If you are interested in observability, these articles will provide further insights into AWS CloudWatch. Learn about monitoring best practices, log analysis, and improving your AWS monitoring with dashboards:
- AWS CloudWatch Monitoring: Best Practices
- Comprehensive Guide to AWS CloudWatch Logs for Log Analysis and Insights
- Improve Your AWS Monitoring with CloudWatch Dashboards
Related Posts
Similar content found using AWS S3 Vectors semantic search