Your AWS application works most of the time. Lambda functions handle requests. ECS containers run your services. Then a user complains about slow response times or errors.
You check CloudWatch logs and see scattered error messages across different services. You know something broke, but figuring out where the request failed means jumping between Lambda logs, ECS container logs, and API Gateway metrics. You're debugging with incomplete information.
What you'll build
By the end of this tutorial, you'll have:
- Automatic service discovery that maps your application topology in real-time
- Request tracing through ECS containers to Lambda functions
- Custom business logic spans for detailed application code visibility
- Real-time service maps in CloudWatch Application Signals
- Transaction Search to follow individual requests across your stack
No more jumping between different log streams to debug issues.
We'll solve this with Application Signals and OpenTelemetry. Application Signals maps your services and tracks key metrics. OpenTelemetry instruments your code to trace requests across all services. You can see the exact path a request took through your system. Similar to X-Ray but infrastructure-agnostic.
This article shows how to build observability for applications using Fargate containers and Lambda functions. You'll instrument everything to trace requests across your stack. Service maps show how your services communicate.
All the code and infrastructure configurations are available in our example repository. The project uses SST v3 to deploy everything, making it easy to follow along and experiment with different configurations in your own AWS account.
 awsfundamentals-hq / cloudwatch-application-signals-otel
🔒 A project demonstrating cloudwatch application signals otel
awscloud
View on GitHub →
What is CloudWatch Application Signals?
CloudWatch Application Signals is AWS's automatic application monitoring service. It watches your applications running on EC2, ECS, and Lambda without custom monitoring code.
The service tracks five key metrics: call volume, availability, latency, faults, and errors. Application Signals also builds a visual map called Application Map of your services automatically.
Why it matters
Before Application Signals, observability required custom dashboards, metric collection code, and manual service correlation. Application Signals automates this.
You can set up Service Level Objectives (SLOs) to track application performance. To ensure your API responds within 500ms for 99% of requests, create an SLO and Application Signals monitors it.
What is OpenTelemetry
OpenTelemetry (OTEL) is an open-source observability framework that instruments your application code to collect traces, metrics, and logs. It tracks request flow through your system.
When a user makes a request to your API, OpenTelemetry creates a trace that follows that request through every service. It records timing, data flow between services, and error locations. This creates a complete timeline for each request.
Combining Application Signals with OpenTelemetry
AWS services generate metrics automatically, but they don't show what happens inside your application code. OpenTelemetry fills this gap by tracking custom business logic, database queries, and external API calls.
Combining OpenTelemetry with CloudWatch Application Signals provides AWS service metrics and detailed application traces in one place. You can see that your Lambda function is slow, then drill down to find the specific database query causing the issue.
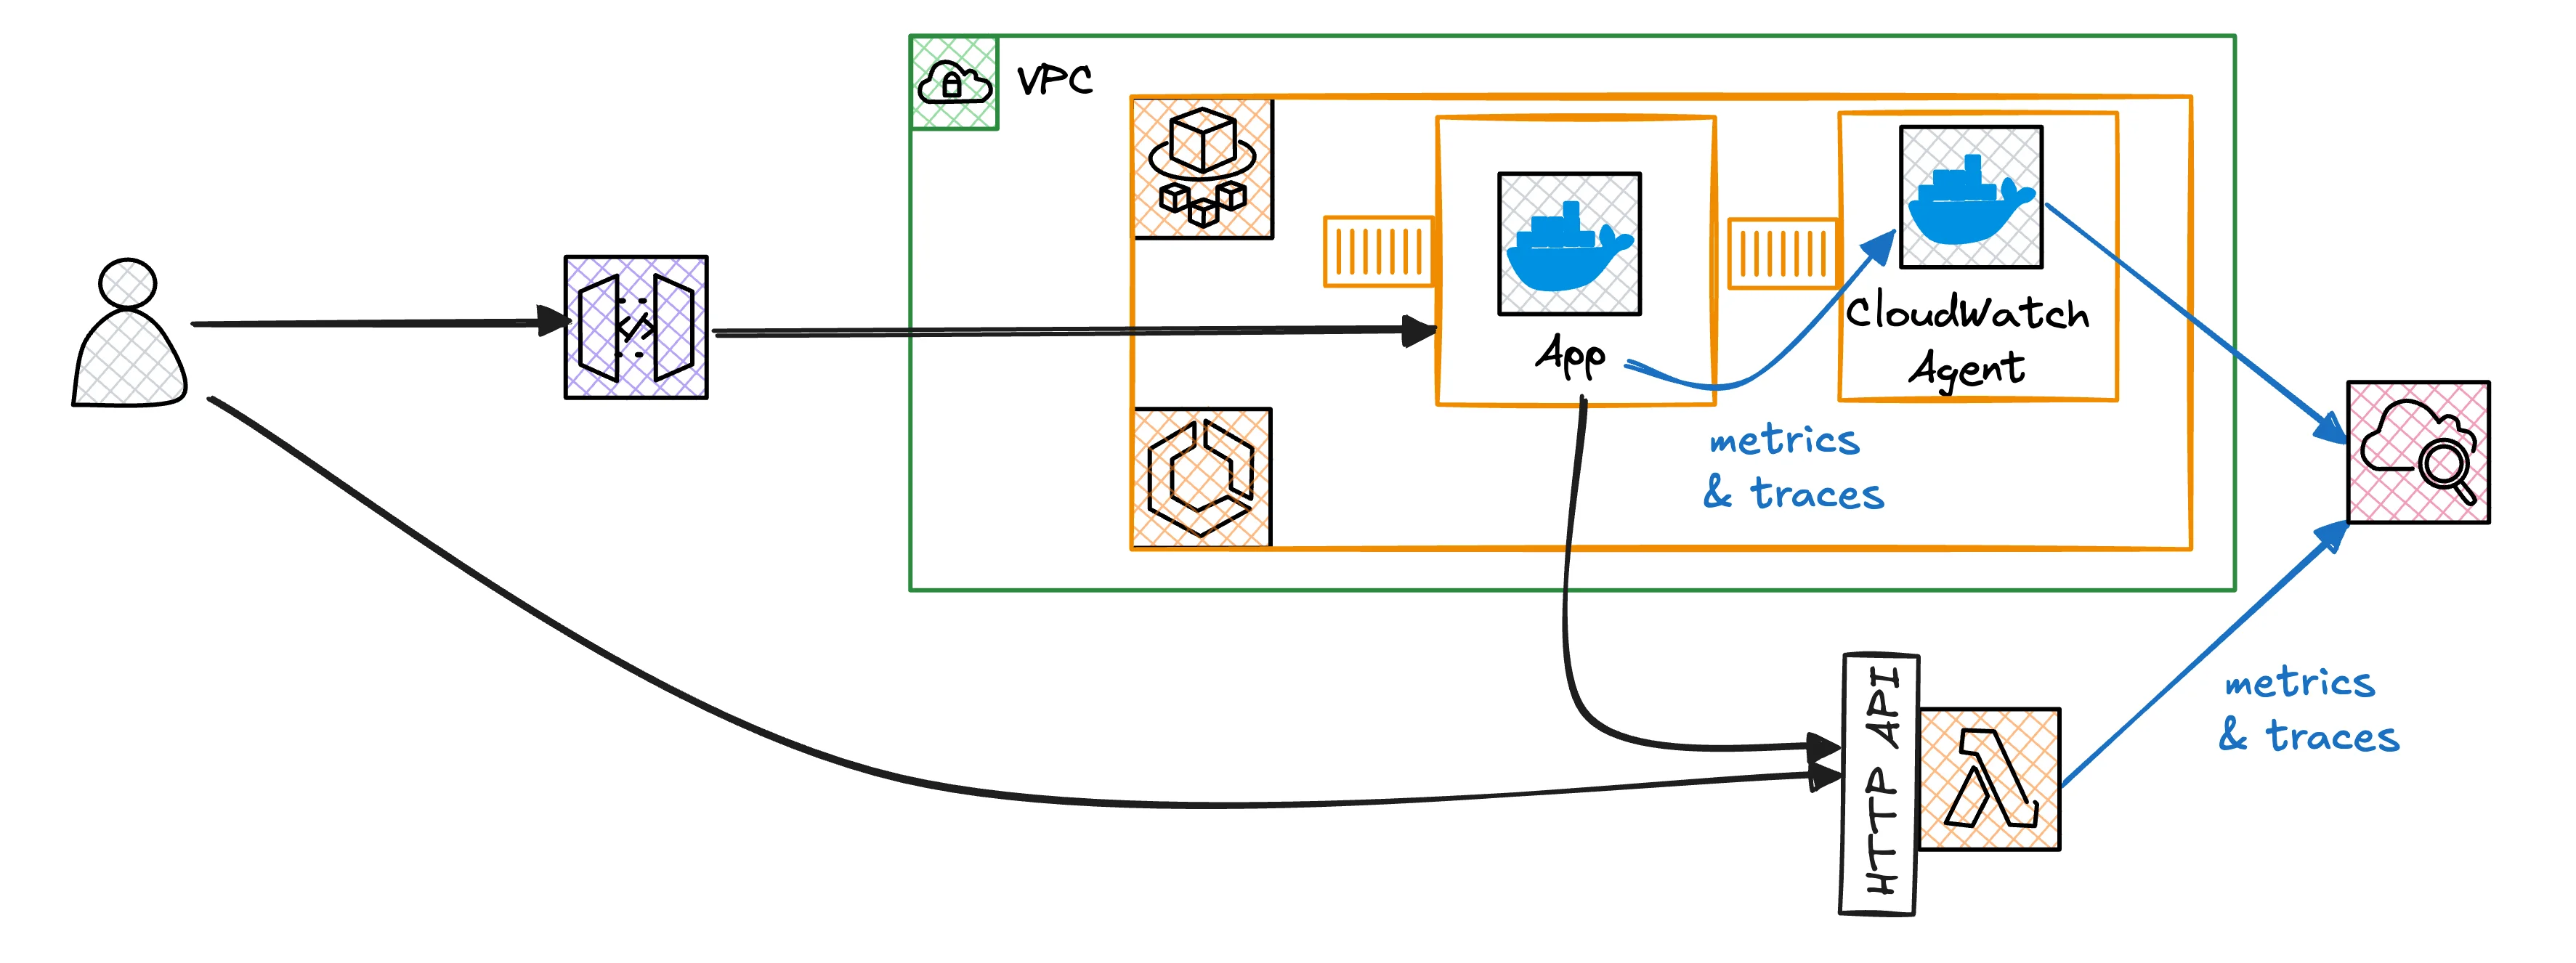
Setting Up OpenTelemetry on ECS with Fargate
Setting up OpenTelemetry on ECS requires:
- A simple application deployed to Fargate
- The OpenTelemetry API dependency
- Instrumentation of the backend application with the OTEL library
- The CloudWatch agent that receives OTEL traces and forwards them to CloudWatch
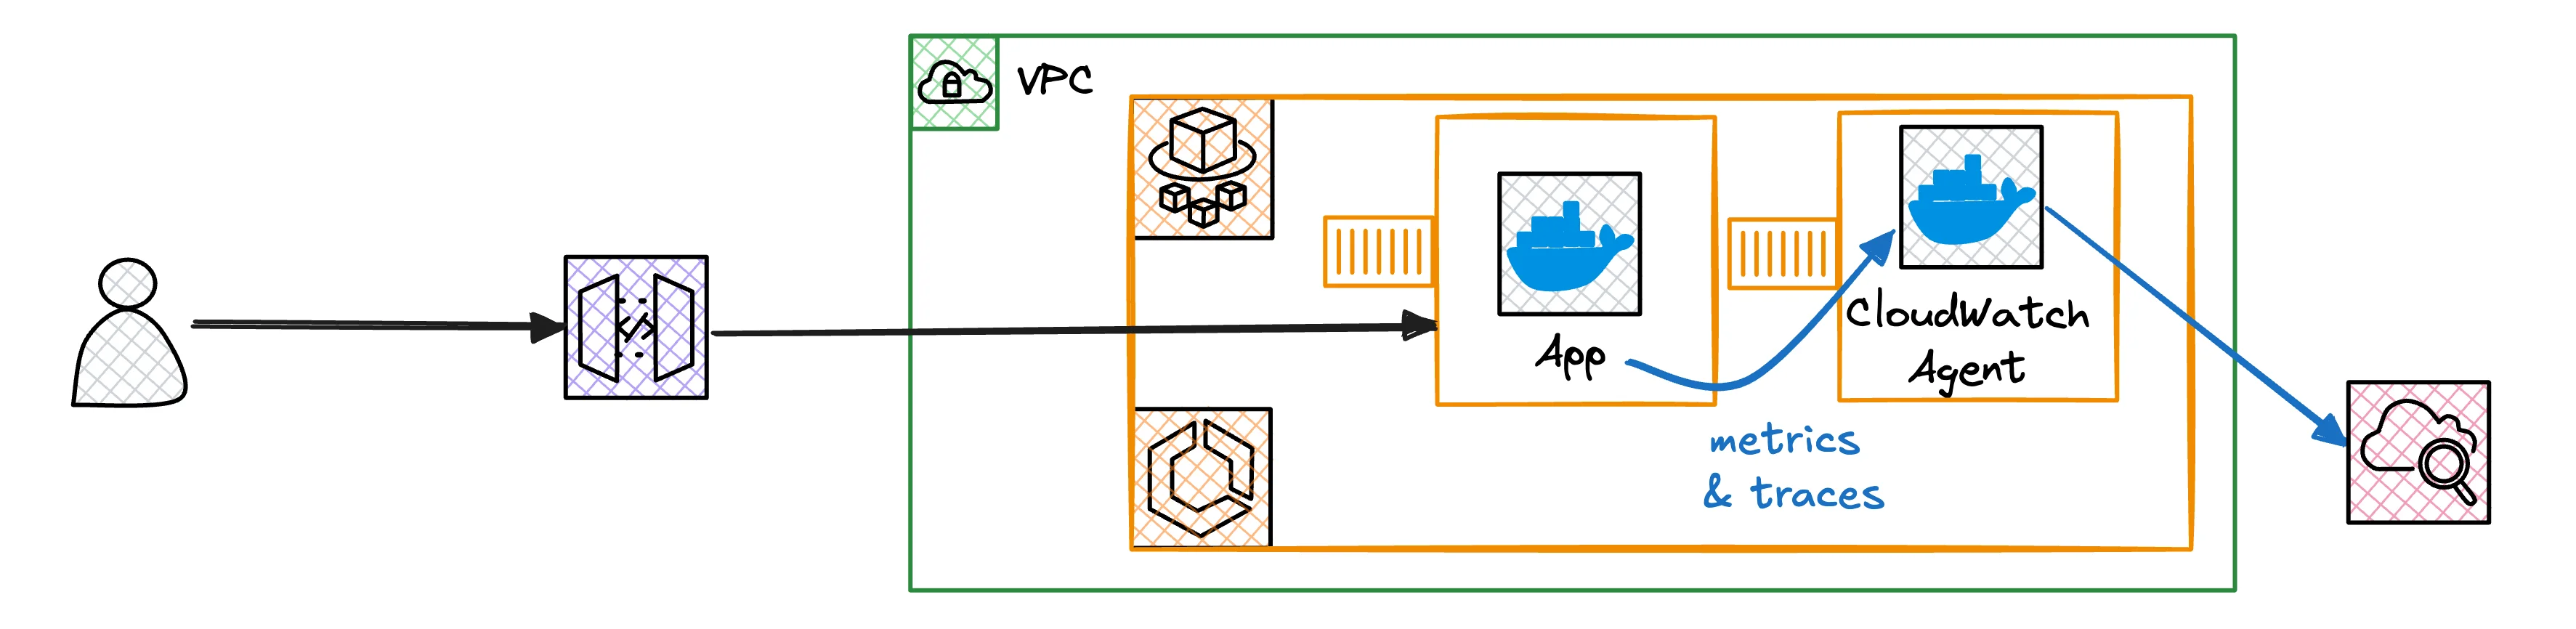
OpenTelemetry on ECS Fargate uses two containers. The CloudWatch Agent container collects telemetry data. Your application container includes OpenTelemetry instrumentation.
The tutorial covers complete setup including IAM roles, ECS infrastructure, environment variables, and verification steps. You'll also learn how to set up OpenTelemetry on Lambda using the ADOT layer, create custom spans for detailed tracing, and explore your traces in CloudWatch Transaction Search.
🚀 Read the Full Tutorial →