Effortless Observability - Integrating CloudWatch Application Signals with OpenTelemetry

Table of Contents
Jump to a section
Your AWS application works most of the time. Lambda functions handle requests. ECS containers run your services. Then a user complains about slow response times or errors.
You check CloudWatch logs and see scattered error messages across different services. You know something broke, but figuring out where the request failed means jumping between Lambda logs, ECS container logs, and API Gateway metrics. You're debugging with incomplete information.
What you'll build
By the end of this tutorial, you'll have:
- Automatic service discovery that maps your application topology in real-time
- Request tracing through ECS containers to Lambda functions
- Custom business logic spans for detailed application code visibility
- Real-time service maps in CloudWatch Application Signals
- Transaction Search to follow individual requests across your stack
No more jumping between different log streams to debug issues.
We'll solve this with Application Signals and OpenTelemetry. Application Signals maps your services and tracks key metrics. OpenTelemetry instruments your code to trace requests across all services. You can see the exact path a request took through your system. Similar to X-Ray but infrastructure-agnostic.
This article shows how to build observability for applications using Fargate containers and Lambda functions. You'll instrument everything to trace requests across your stack. Service maps show how your services communicate.
All the code and infrastructure configurations are available in our example repository. The project uses SST v3 to deploy everything, making it easy to follow along and experiment with different configurations in your own AWS account.

CloudWatch on One Page (No Fluff)
Monitor like a pro. Our CloudWatch cheat sheet covers metrics, alarms, and logs - everything you need for effective AWS monitoring.
HD quality, print-friendly. Stick it next to your desk.
What is CloudWatch Application Signals?
CloudWatch Application Signals is AWS's automatic application monitoring service. It watches your applications running on EC2, ECS, and Lambda without custom monitoring code.
Enable it and it starts collecting metrics.
The service tracks five key metrics.
- Call volume measures how many requests your services handle
- Availability shows what percentage of requests succeed
- Latency tracks how long requests take to complete
- Faults indicates when your application throws errors
- Errors counts when requests fail or return error codes
Application Signals also builds a visual map called Application Map of your services automatically. It discovers how your Lambda functions call your ECS containers, which databases they connect to, and what external APIs you use.
No configuration needed.
Why it matters
Before Application Signals, observability required custom dashboards, metric collection code, and manual service correlation. Application Signals automates this.
You can set up Service Level Objectives (SLOs) to track application performance. To ensure your API responds within 500ms for 99% of requests, create an SLO and Application Signals monitors it.
The service works with Java, Python, Node.js, and .NET applications. It supports EKS, ECS, and EC2. We'll focus on ECS Fargate and Lambda in this tutorial since they're the most common serverless patterns.
What is OpenTelemetry
OpenTelemetry (OTEL) is an open-source observability framework that instruments your application code to collect traces, metrics, and logs. It tracks request flow through your system.
When a user makes a request to your API, OpenTelemetry creates a trace that follows that request through every service. It records timing, data flow between services, and error locations. This creates a complete timeline for each request.
The framework supports most programming languages and integrates with popular libraries automatically. For Node.js applications, it can instrument Express, AWS SDK calls, database queries, and HTTP requests without you changing your existing code.
Combining Application Signals with OpenTelemetry
AWS services generate metrics automatically, but they don't show what happens inside your application code. OpenTelemetry fills this gap by tracking custom business logic, database queries, and external API calls.
Combining OpenTelemetry with CloudWatch Application Signals provides AWS service metrics and detailed application traces in one place. You can see that your Lambda function is slow, then drill down to find the specific database query causing the issue.
AWS provides the AWS Distro for OpenTelemetry (ADOT), a wrapper for instrumenting applications with OpenTelemetry on AWS-managed services like ECS. It's available as a Lambda Layer for instrumenting Lambda functions with one reference.
For a complete guide to OpenTelemetry on AWS, including advanced configuration options and best practices, check out our OpenTelemetry deep-dive article.
Setting Up OpenTelemetry on ECS with Fargate
Setting up OpenTelemetry on ECS requires:
- A simple application deployed to Fargate
- The OpenTelemetry API dependency
- Instrumentation of the backend application with the OTEL library
- The CloudWatch agent that receives OTEL traces and forwards them to CloudWatch

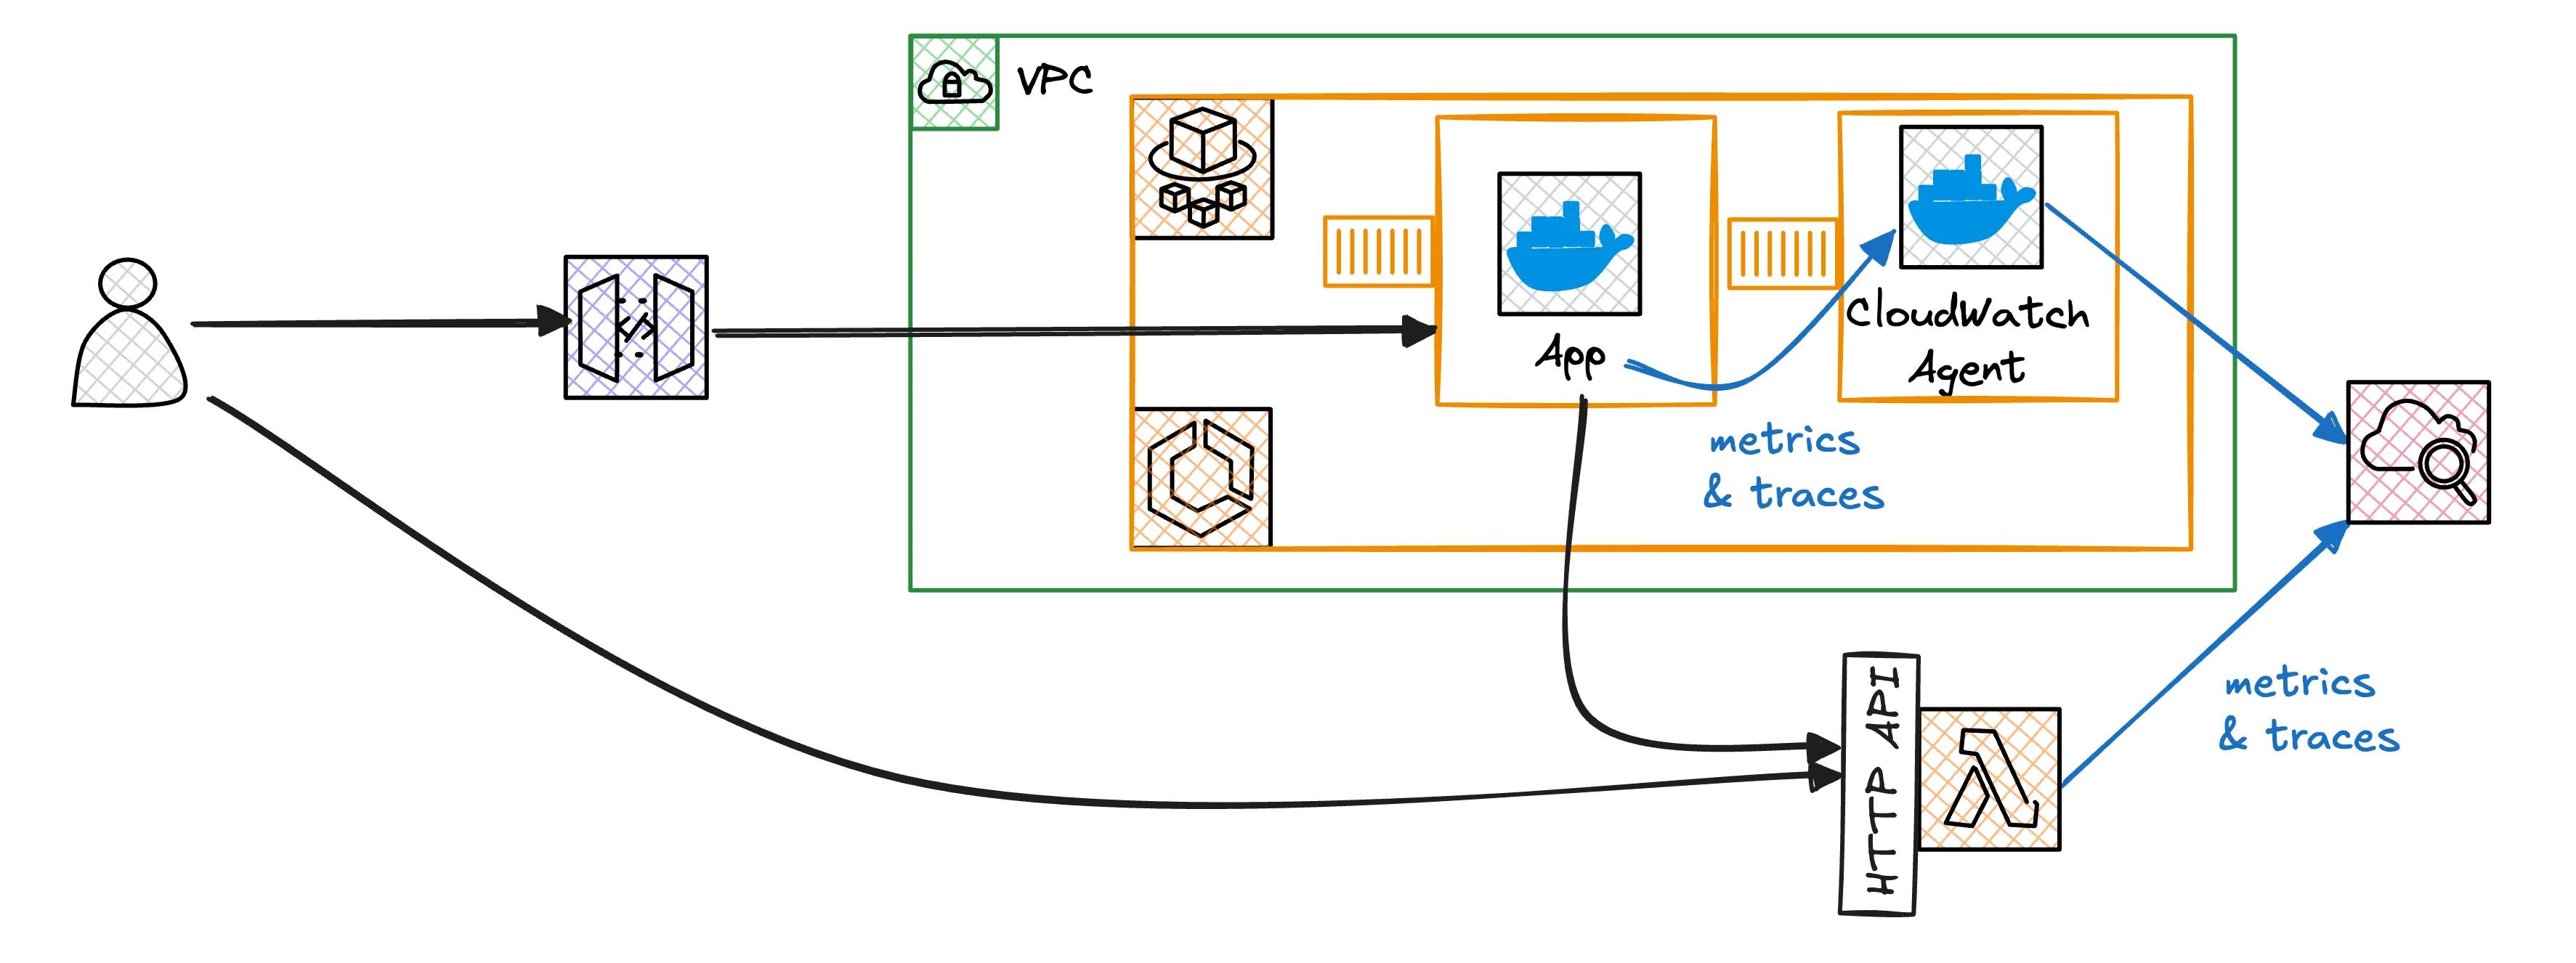
OpenTelemetry on ECS Fargate uses two containers. The CloudWatch Agent container collects telemetry data. Your application container includes OpenTelemetry instrumentation.
Prerequisites
We recommend checking out our repository and deploying everything into your own account. This makes it easier to follow along and test each step.
Before starting, make sure you have Node.js, pnpm, AWS CLI, and Docker installed.
You'll also need valid AWS credentials for your deployment account. If you haven't set up your AWS account properly yet, we recommend configuring everything including multi-factor authentication.
Step 1: Set up Our Two Container Architecture
The ECS task definition includes two containers:
⚡️ Backend Application Container:
- Built by SST from your
Dockerfilein the backend directory - Contains your Node.js application with OpenTelemetry instrumentation
- Sends telemetry data to the CloudWatch Agent container
🔎 CloudWatch Agent Container:
- Uses AWS's pre-built image:
public.ecr.aws/cloudwatch-agent/cloudwatch-agent:latest - No custom build required
- Receives telemetry data from your app and forwards it to CloudWatch Application Signals
SST handles container orchestration when you define both containers in your service configuration.
Step 2: Set Up IAM Roles and ECS Infrastructure
IAM Roles: ECS tasks need two roles with specific managed policies. The execution role handles container startup (pulling images, accessing SSM). The task role allows containers to write telemetry data to CloudWatch and X-Ray. SST creates these roles with required policies.
ECS Architecture: SST sets up the ECS infrastructure:
- 🌐 VPC creates a private network with public and private subnets
- 🖥️ ECS Cluster provides the compute environment where tasks run
- ⚙️ ECS Service manages the desired number of running tasks
- 📋 Task Definition defines your two containers and their configuration
- 🚺 API Gateway provides HTTP access to your Fargate tasks
SST connects API Gateway to your Fargate service via VPC integration and CloudMap service discovery. API Gateway routes requests directly to your containers in private subnets without exposing them to the internet.
Step 3: Configure Your Application Container
Your Node.js application needs specific environment variables to enable OpenTelemetry.
OTEL_SERVICE_NAMEidentifies your service in traces and metricsOTEL_RESOURCE_ATTRIBUTESadds metadata to telemetry dataOTEL_AWS_APPLICATION_SIGNALS_ENABLEDenables Application Signals collectionOTEL_AWS_APPLICATION_SIGNALS_EXPORTER_ENDPOINTwhere to send Application Signals metrics (CloudWatch Agent)OTEL_EXPORTER_OTLP_TRACES_ENDPOINTwhere to send trace data (CloudWatch Agent)NODE_OPTIONSinstruments your app without code changes
All endpoints point to localhost:4316 where the CloudWatch Agent container listens.
Step 4: Add OpenTelemetry Dependencies
In your package.json, add the AWS Distro for OpenTelemetry:
{
    "dependencies": {
        // [...]
        "@aws/aws-distro-opentelemetry-node-autoinstrumentation": "^0.7.0"
    }
}
Alternative Approach: Instead of adding dependencies to your application, you could use an init sidecar container with AWS's pre-built OpenTelemetry image. This requires setting up a shared volume between containers, which is more complex but keeps application dependencies cleaner. We use the dependency approach for simplicity.
Step 5: Deploy and Verify
Deploy your ECS service with SST:
pnpm run sst:deploy:dev
Once deployed, test your service by calling the API Gateway endpoint:
pnpm run invoke:ecs:dev
This script checks for the API Gateway URL from your SST deployment and makes test requests. If everything works correctly, you should see a success message with response headers that include tracing information:
HTTP/2 200
date: Mon, 20 Oct 2025 10:25:55 GMT
content-type: application/json; charset=utf-8
content-length: 32
x-powered-by: Express
traceparent: 00-68f60e33c467237354e84bb71e725d1d-3684e3844b027c82-1
trace_id: 68f60e33c467237354e84bb71e725d1d
x-startup: 57 seconds ago
x-task-definition: 1
etag: W/"20-3mrbqUO0pwOKyIU9nGe4a9Fe+xM"
apigw-requestid: SvcoDjgsoAMEbsw=
The key headers to look for are:
traceparent- W3C trace context header containing trace ID and span IDtrace_id- The unique identifier for this request trace
After generating some traffic, check that both containers are healthy in the ECS console. You should see telemetry data flowing to CloudWatch Application Signals within a few minutes.
Setting Up OpenTelemetry on AWS Lambda
Setting up OpenTelemetry on Lambda is simpler than ECS because AWS provides the ADOT (AWS Distro for OpenTelemetry) Lambda Layer. This layer contains all instrumentation code, so you don't need to add dependencies to your Lambda function.
The Lambda Layer Approach
Instead of bundling OpenTelemetry with your function code, complete three steps.
- 🎯 Add the ADOT Lambda Layer - AWS provides pre-built layers for different architectures and Node.js versions
- 🔧 Configure environment variables to tell the layer how to instrument your function
- ⚡ Enable Function URL to provide HTTP access to your Lambda for testing

AWS provides separate layer versions for different Lambda architectures.
- amd64 for x86-based processors
- arm64 for ARM-based processors
You can find the current layer versions and ARNs for all regions in the official ADOT documentation.
SST handles the Lambda creation and automatically configures the necessary IAM policies for CloudWatch Application Signals.
Step 1: Configure the Lambda Function
Our Lambda function uses these key configuration elements:
const lambdaFunction = new sst.aws.Function('lambdaFunction', {
    name: `${$app.name}-${$app.stage}-lambda`,
    runtime: aws.lambda.Runtime.NodeJS20dX,
    handler: 'lambda/handler.handler',
    policies: ['arn:aws:iam::aws:policy/CloudWatchLambdaApplicationSignalsExecutionRolePolicy', 'arn:aws:iam::aws:policy/AWSXRayDaemonWriteAccess'],
    layers: ['arn:aws:lambda:us-east-1:901920570463:layer:aws-otel-nodejs-amd64-ver-1-30-2:1'],
    transform: {
        function: {
            tracingConfig: { mode: 'Active' },
        },
    },
});
Step 2: Environment Variables
The Lambda function needs these environment variables.
OTEL_SERVICE_NAMEidentifies your Lambda in tracesAWS_LAMBDA_EXEC_WRAPPERpoints to the OTEL handler wrapper (/opt/otel-handler)LAMBDA_APPLICATION_SIGNALS_REMOTE_ENVIRONMENTsets the environment name for Application SignalsOTEL_RESOURCE_ATTRIBUTESprovides additional metadata for telemetry data
The ADOT layer automatically instruments your Lambda without any code changes. It captures function invocations, AWS SDK calls, and HTTP requests.
Step 3: Custom Instrumentation (Optional)
The ADOT layer automatically instruments Lambda invocations and AWS SDK calls. You can add custom spans to trace your business logic in detail. This is where the OpenTelemetry API package becomes valuable.
import { trace } from '@opentelemetry/api';

const tracer = trace.getTracer(process.env.OTEL_SERVICE_NAME!);

export const handler = async (event: APIGatewayProxyEvent) => {
    const customSpan = tracer.startSpan('lambda-span');

    // Your business logic here

    customSpan.end();

    return {
        statusCode: 200,
        body: JSON.stringify({ message: 'Hello from Lambda!' }),
    };
};
Understanding Custom Spans:
trace.getTracer()gets a tracer instance using your service nametracer.startSpan()creates a new span with a descriptive namecustomSpan.end()closes the span and records its duration
Custom spans allow you to:
- Track specific function execution times
- Add metadata about business operations
- Create hierarchical traces that show how different parts of your code relate
- Debug performance bottlenecks in your application logic
These custom spans appear in CloudWatch's Transaction Search when you search for specific trace IDs. This gives you detailed visibility into your custom code execution alongside AWS service calls within individual traces.
Step 4: Test Your Lambda Function
After deployment, test your Lambda function:
pnpm run invoke:lambda:dev
This script calls your Lambda's Function URL and should return a response with tracing headers, similar to the ECS example. The telemetry data will appear in CloudWatch Application Signals alongside your ECS traces. This gives you end-to-end visibility across both compute platforms.
Exploring the Application in CloudWatch
Once both services are deployed, test different request patterns to see how OpenTelemetry traces requests across your distributed system.
- Direct ECS requests call the ECS container via API Gateway
- Direct Lambda requests call the Lambda function via its Function URL
- Cross-service requests call the ECS
/lambdaendpoint, which makes an HTTP request to the Lambda function
Make a few requests using each pattern:
# Test ECS container directly
pnpm run invoke:ecs:dev

# Test Lambda function directly
pnpm run invoke:lambda:dev

# Test ECS calling Lambda (cross-service)
INVOKE_PATH=/lambda pnpm run invoke:ecs:dev
After generating traffic and waiting a few minutes, CloudWatch Application Signals builds your application map. Navigate to the Application Signals service map to see these components.
- ECS Application represents your Fargate container service
- Lambda Function represents your serverless function
- ECS Metadata Service shows up because our ECS app calls the metadata endpoint during bootstrap
- Connection lines show how services communicate with each other
Diving into Transaction Search
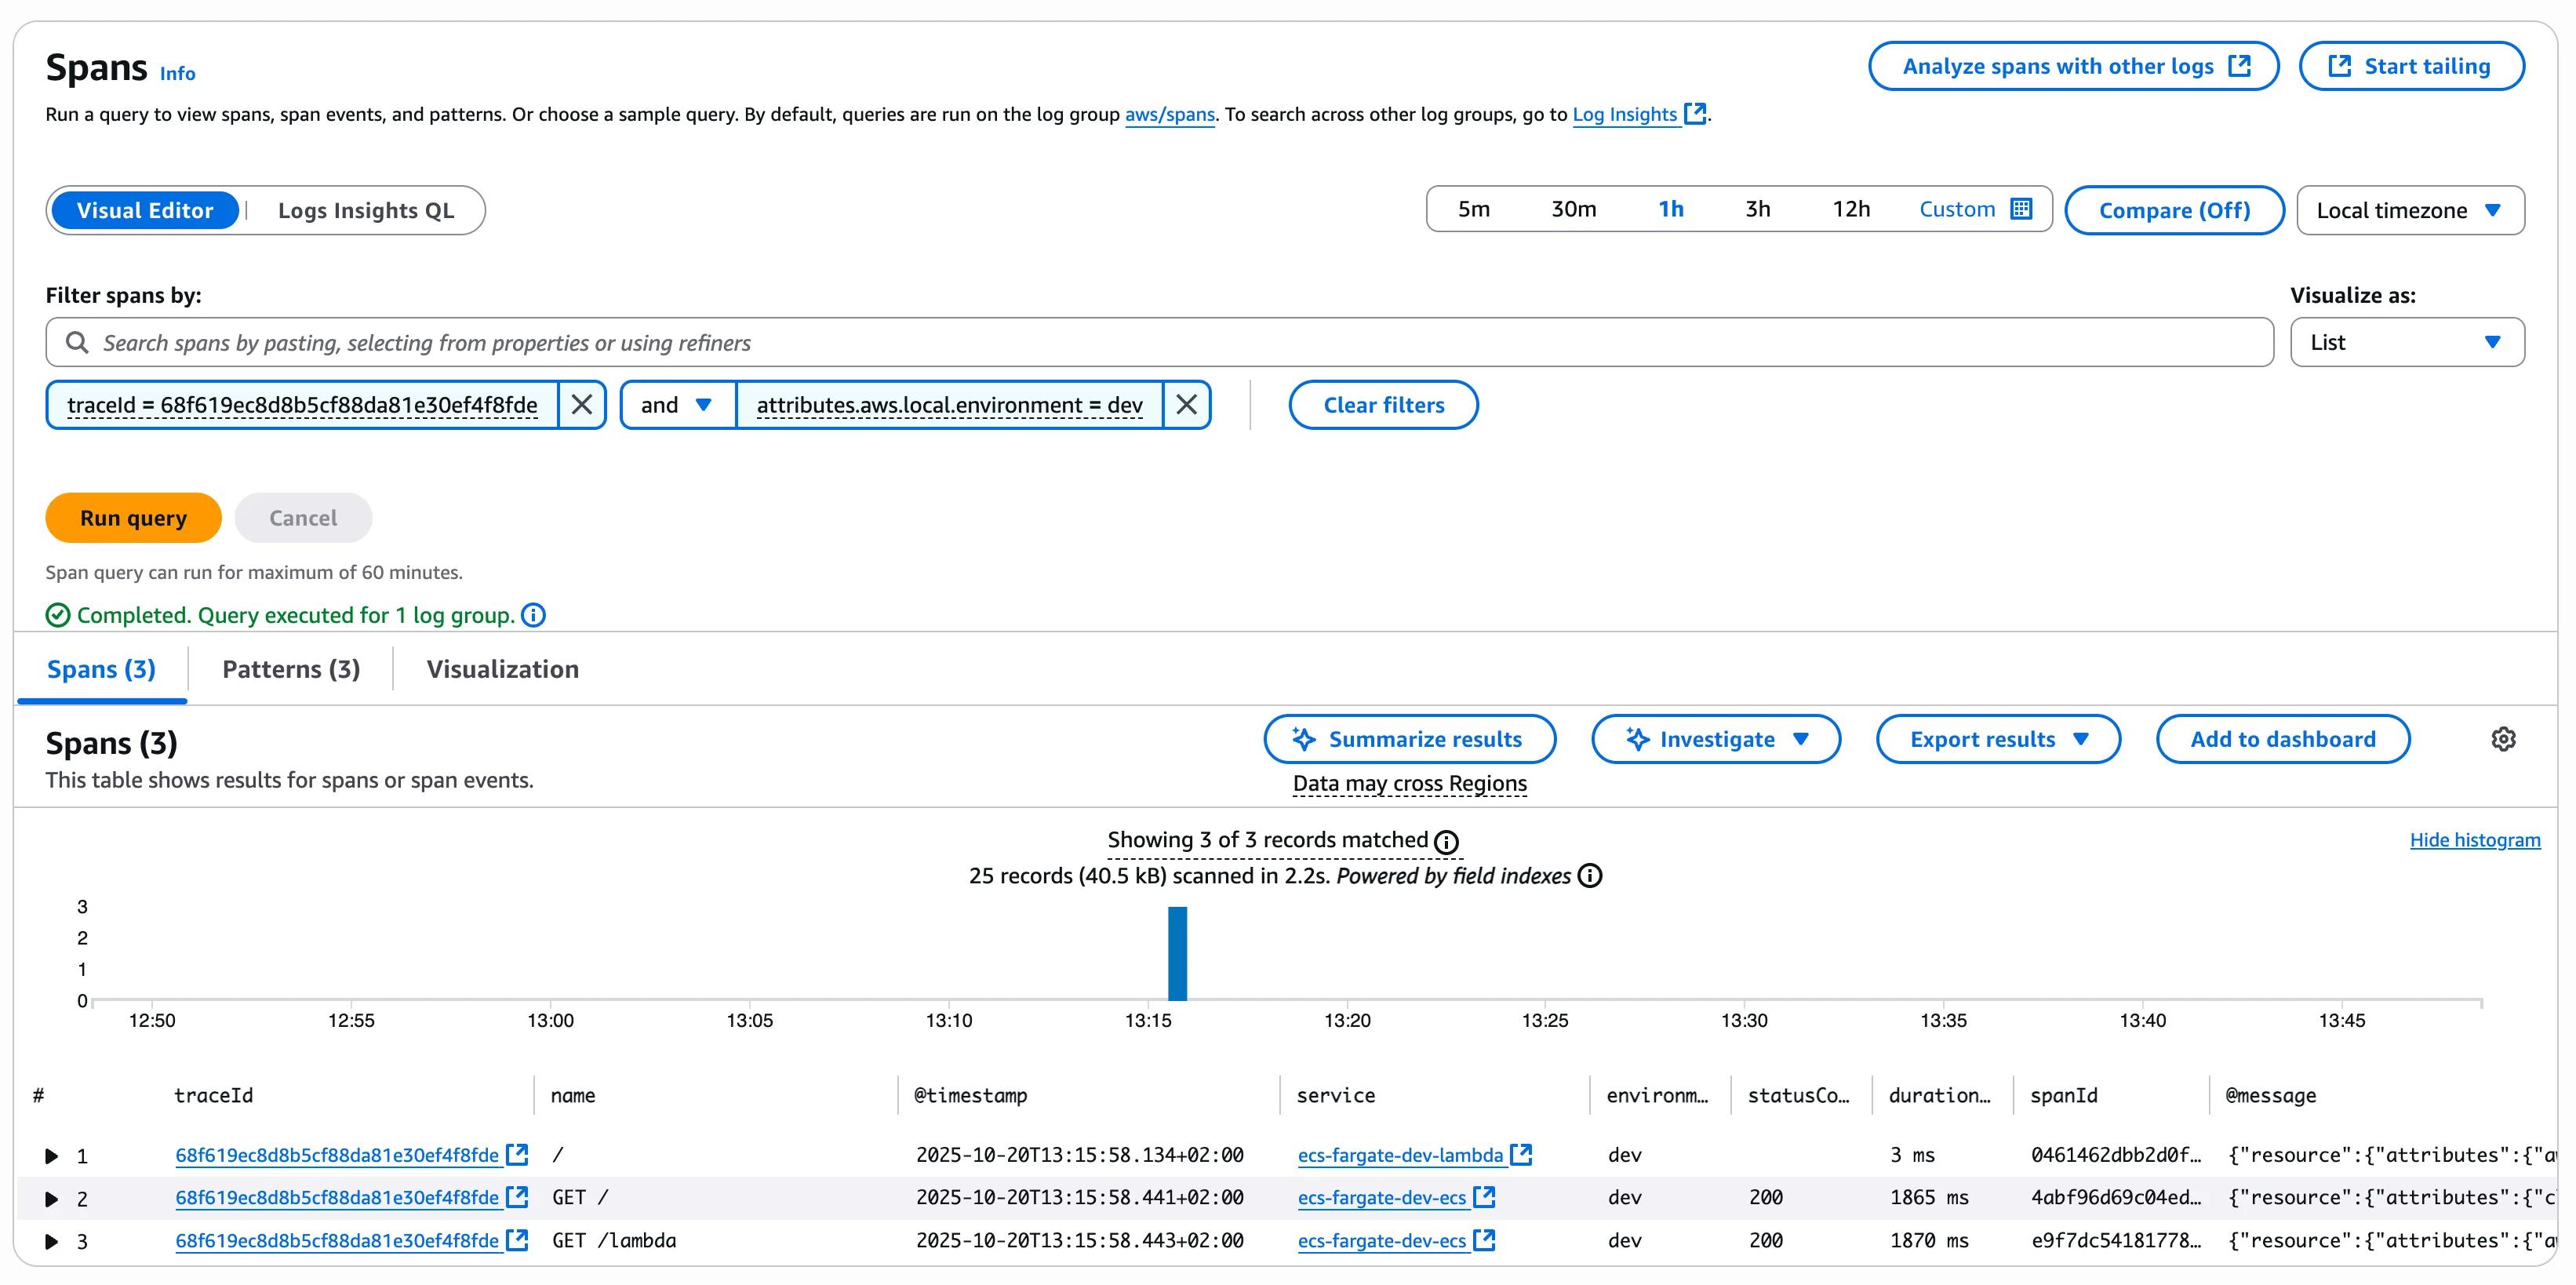
For detailed trace analysis, use CloudWatch's Transaction Search. When you make a cross-service request (ECS to Lambda), you can follow these steps.
- Copy the trace ID from the response headers (
trace_idor extract fromtraceparent) - Search for the trace in Transaction Search using the trace ID
- Click on the trace in the search to be taken to the detailed trace overview
- Explore the complete request flow to see spans showing the following:
- ECS container processing the request
- HTTP call from ECS to Lambda Function URL
- Lambda function execution
- Custom spans if you added any business logic tracing
By clicking on our trace, a new tab will open with the detailed trace:
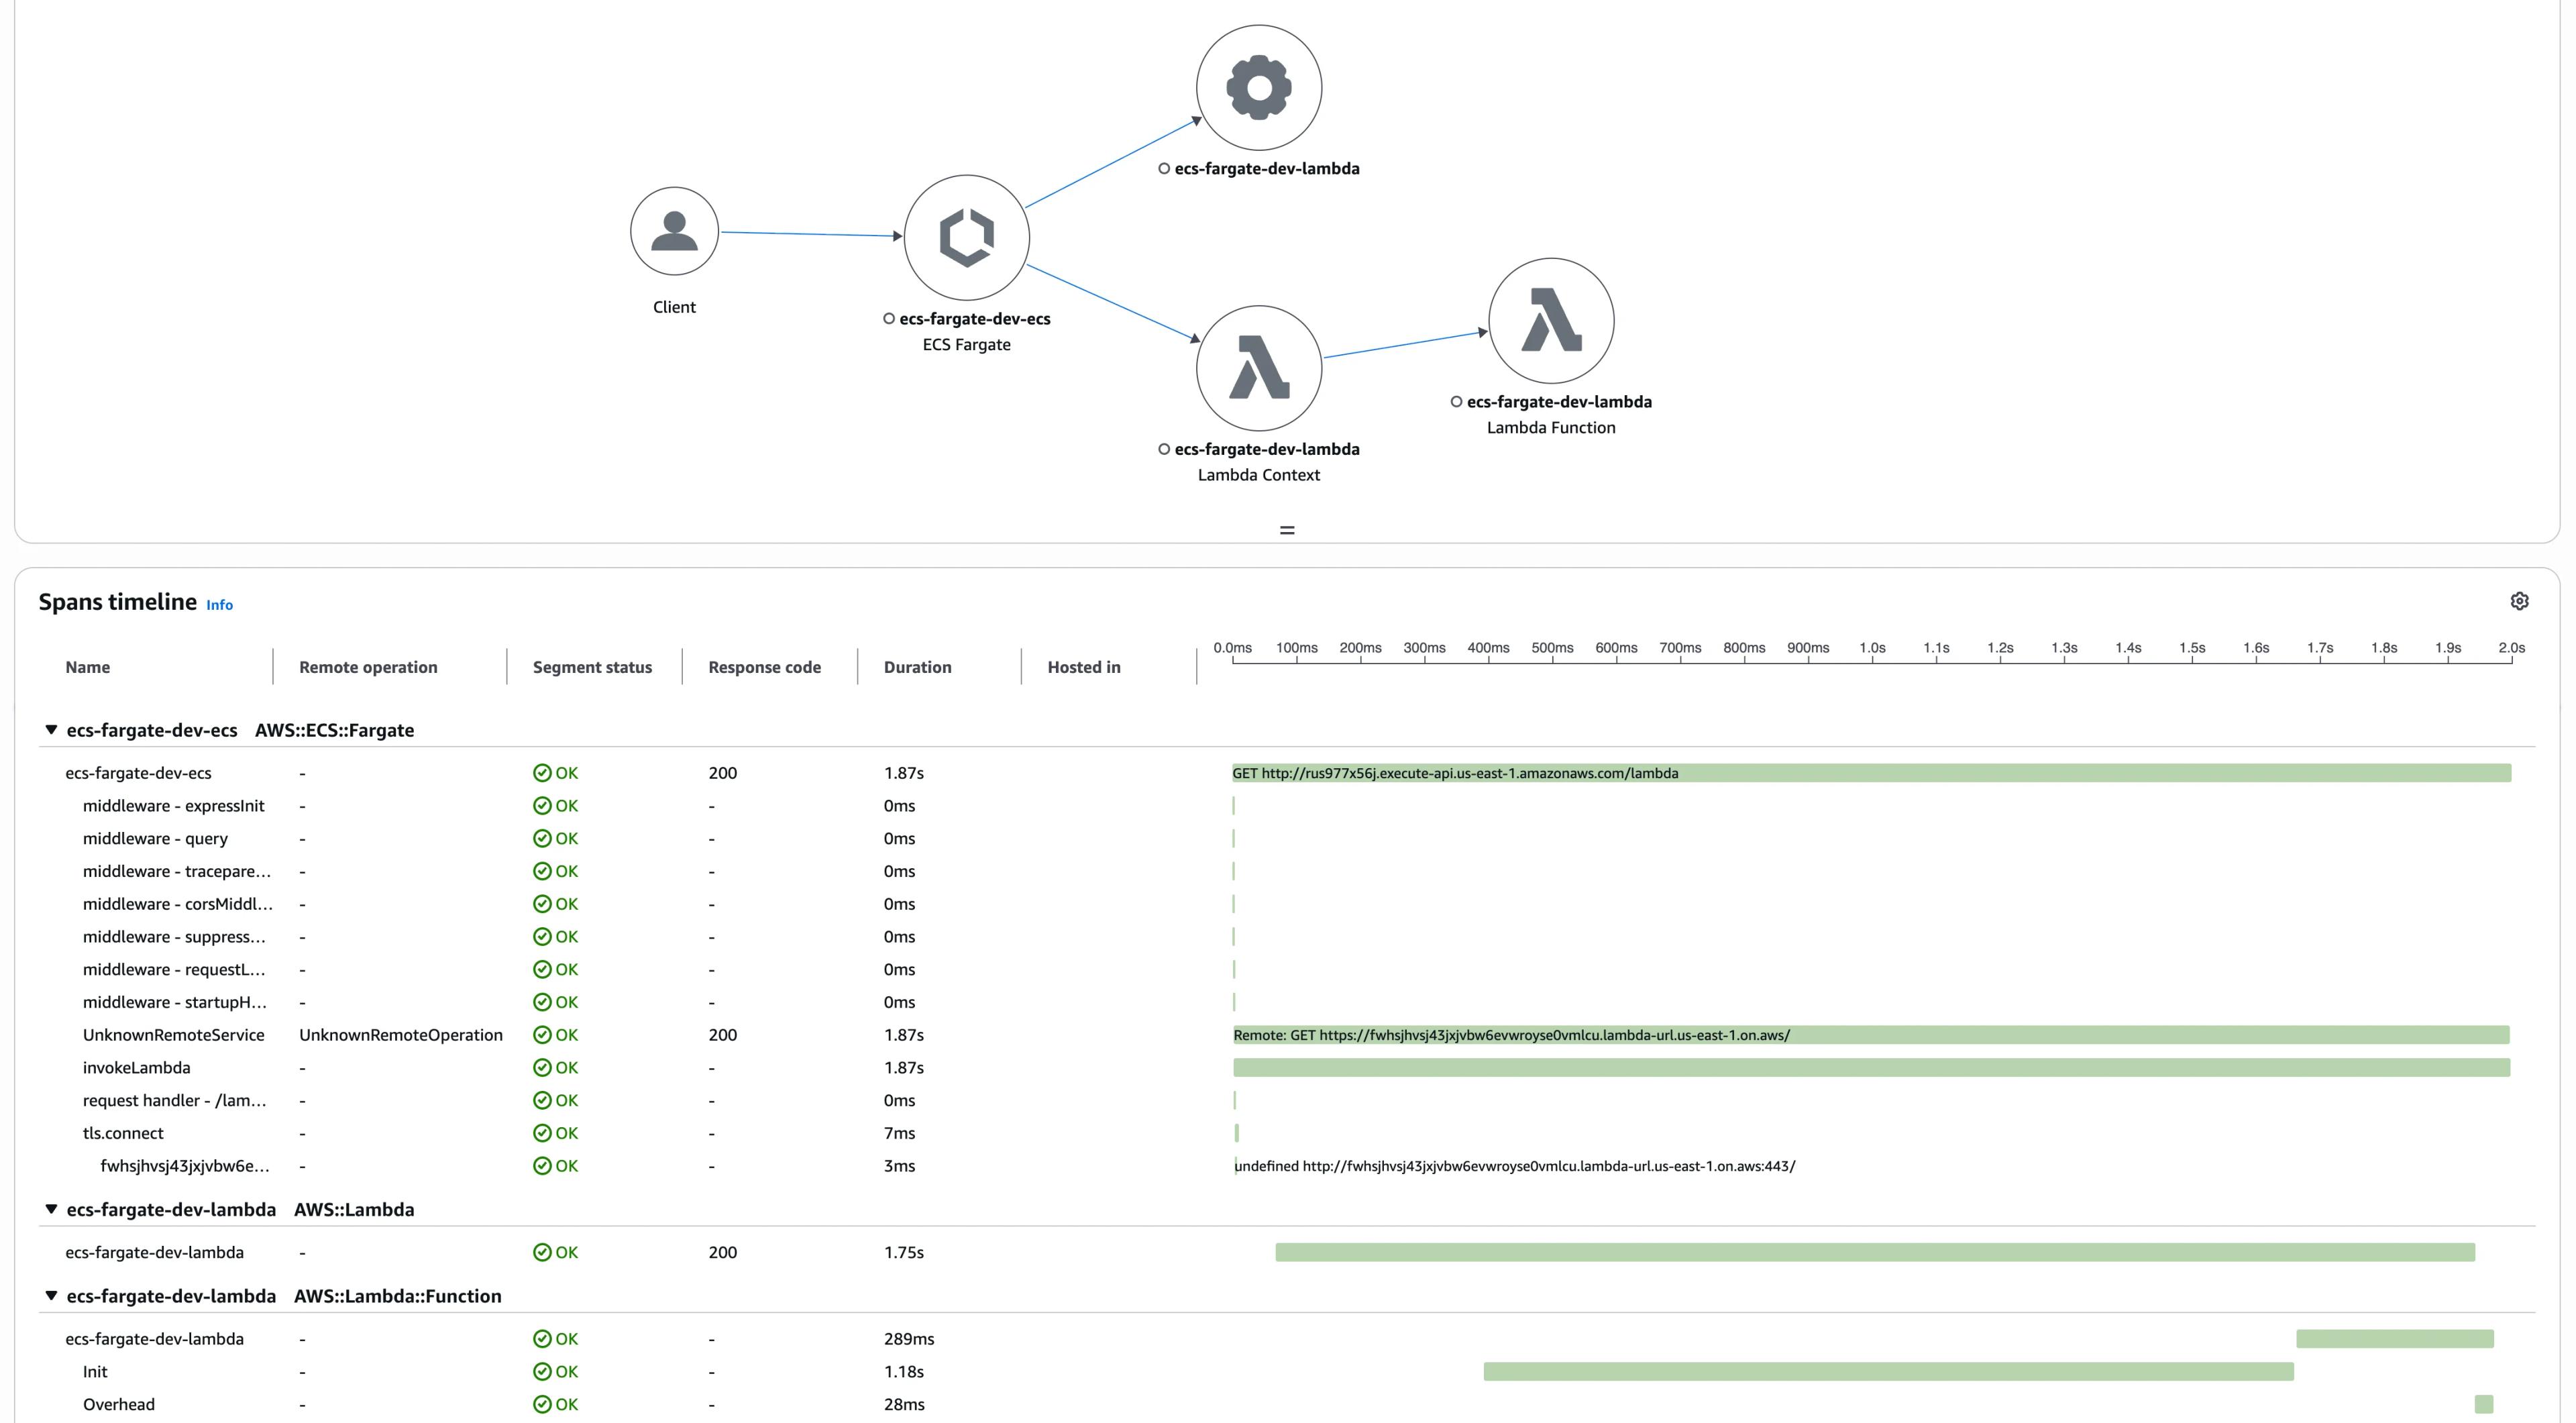
In the trace view, we can see the services involved in the request and the detailed spans.
This includes our custom invokeLambda span from our ECS app, plus the lambda-span from our Lambda function.

Advanced OpenTelemetry Implementation Details
Our example implementation includes several advanced patterns that show how to handle real-world observability challenges.
Custom Middlewares for Better Tracing
The ECS application uses several custom Express middlewares that enhance the tracing experience:
Trace Suppression for Health Checks:
export const suppressTracingMiddleware = (req: Request, res: Response, next: NextFunction) => {
    if (req.path === '/health') {
        const suppressedContext = suppressTracing(context.active());
        context.with(suppressedContext, next);
    } else {
        next();
    }
};
Health check endpoints get called frequently by load balancers and monitoring systems. Without suppression, these create unnecessary trace noise.
The suppressTracing function from OpenTelemetry Core prevents trace generation for these routine checks while still allowing the endpoint to function normally.
Automatic Trace Headers:
Our traceparentMiddleware automatically adds trace context headers to every response, making it easy to correlate requests when debugging.
This is especially useful when requests span multiple services.
ECS Metadata Integration:
The startupHeaderMiddleware adds container startup information to response headers, helping you understand container lifecycle and performance patterns in distributed deployments.
External Service Tracing
The /echo endpoint demonstrates how OpenTelemetry automatically instruments external HTTP calls:
app.get('/echo', async (_req, res) => {
    const response = await fetch('https://postman-echo.com/get', {
        method: 'GET',
        headers: { 'Content-Type': 'application/json' },
    });
    // OpenTelemetry automatically traces this external call
});
When you call this endpoint, you'll see spans in Transaction Search that show:
- The incoming request to your ECS container
- The outbound HTTP call to the external Postman Echo API
- Response times and status codes for both calls
This automatic instrumentation works for any HTTP client calls, AWS SDK operations, and database queries without additional configuration.
Custom Spans with Status Tracking
The /lambda endpoint shows how to create custom spans that track both success and failure states:
const lambdaSpan = tracer.startSpan('invokeLambda');
const response = await fetch(lambdaFunctionUrl, {
    method: 'GET',
    headers: { 'Content-Type': 'application/json' },
});
lambdaSpan.setStatus({ code: response.status });
lambdaSpan.end();
The setStatus() method records the HTTP status code in the span, making it easy to identify failed cross-service calls in your traces.
This pattern is useful for any business logic where you want to explicitly track success or failure states.
Dynamic Service Discovery Scripts
The repository includes shell scripts that dynamically extract service URLs from SST outputs and make test requests. These scripts handle the complexity of finding the right endpoints in different environments, making it easy to test your observability setup consistently.
These implementation patterns show how to build production-ready observability that goes beyond basic automatic instrumentation to provide detailed insights into your application behavior.
Conclusion
You've built a complete observability solution that combines CloudWatch Application Signals with OpenTelemetry across ECS Fargate and Lambda. The setup discovers your services and creates topology maps showing how requests flow through your distributed system.
CloudWatch Application Signals collects and organizes telemetry data. OpenTelemetry provides instrumentation that captures detailed traces from your application code. This combination provides production-ready observability without managing complex tracing infrastructure.
The approach works for AWS workloads that mix containers and serverless functions. As your application grows and becomes more distributed, you have the observability foundation to debug issues quickly and understand system behavior.
The complete example code is available in our GitHub repository.
Related Posts
Similar content found using AWS S3 Vectors semantic search


